Armenian vs Immigrants from Belarus Unemployment Among Ages 45 to 54 years
COMPARE
Armenian
Immigrants from Belarus
Unemployment Among Ages 45 to 54 years
Unemployment Among Ages 45 to 54 years Comparison
Armenians
Immigrants from Belarus
5.2%
UNEMPLOYMENT AMONG AGES 45 TO 54 YEARS
0.0/ 100
METRIC RATING
291st/ 347
METRIC RANK
4.6%
UNEMPLOYMENT AMONG AGES 45 TO 54 YEARS
30.6/ 100
METRIC RATING
198th/ 347
METRIC RANK
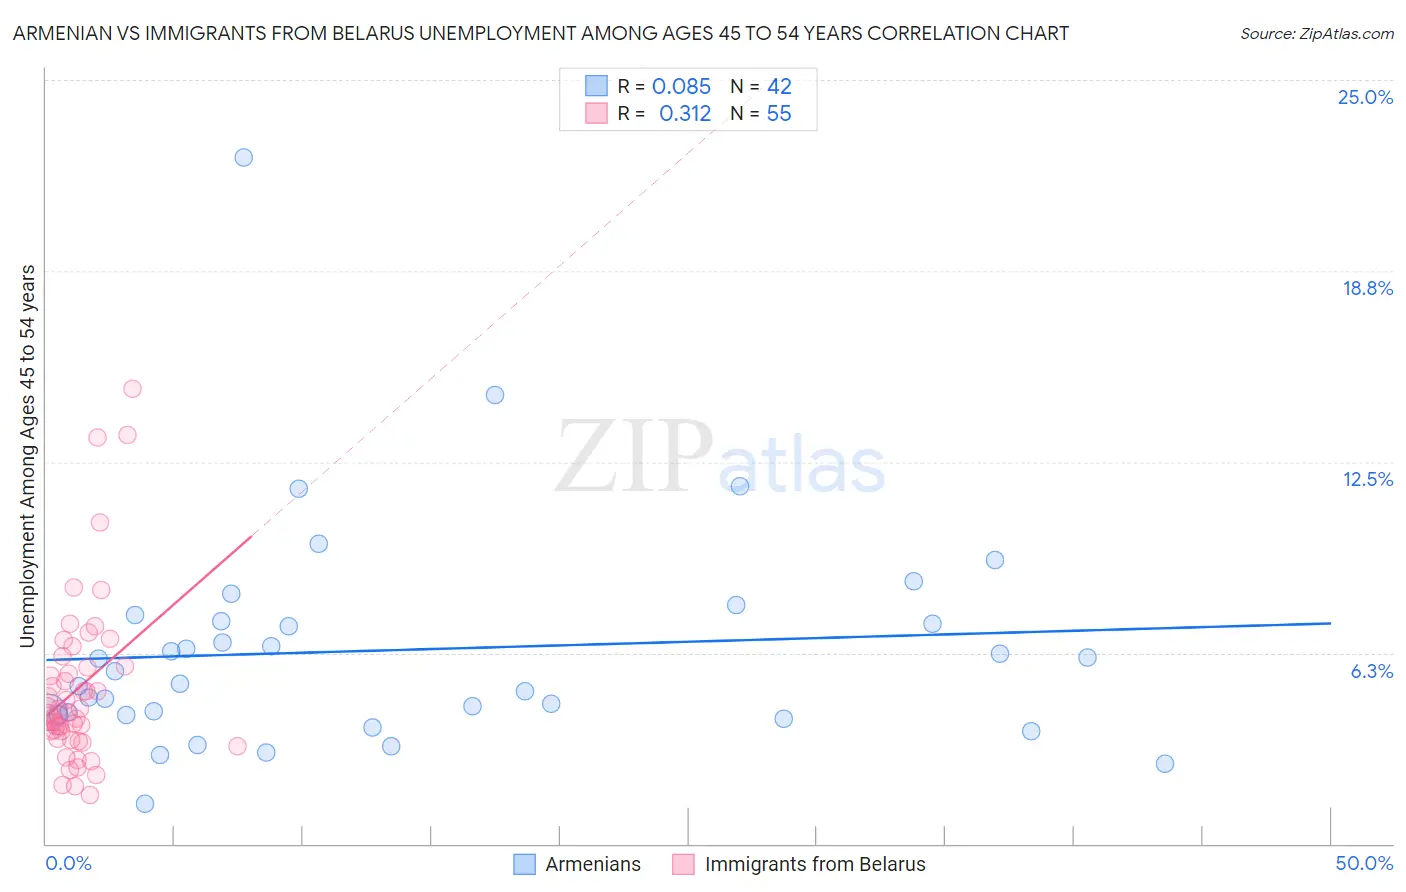
Armenian vs Immigrants from Belarus Unemployment Among Ages 45 to 54 years Correlation Chart
The statistical analysis conducted on geographies consisting of 304,943,132 people shows a slight positive correlation between the proportion of Armenians and unemployment rate among population between the ages 45 and 54 in the United States with a correlation coefficient (R) of 0.085 and weighted average of 5.2%. Similarly, the statistical analysis conducted on geographies consisting of 148,948,827 people shows a mild positive correlation between the proportion of Immigrants from Belarus and unemployment rate among population between the ages 45 and 54 in the United States with a correlation coefficient (R) of 0.312 and weighted average of 4.6%, a difference of 14.0%.
Unemployment Among Ages 45 to 54 years Correlation Summary
| Measurement | Armenian | Immigrants from Belarus |
| Minimum | 1.3% | 1.6% |
| Maximum | 22.5% | 14.9% |
| Range | 21.1% | 13.3% |
| Mean | 6.3% | 5.1% |
| Median | 5.4% | 4.3% |
| Interquartile 25% (IQ1) | 4.2% | 3.5% |
| Interquartile 75% (IQ3) | 7.3% | 5.8% |
| Interquartile Range (IQR) | 3.1% | 2.3% |
| Standard Deviation (Sample) | 3.7% | 2.8% |
| Standard Deviation (Population) | 3.6% | 2.7% |
Similar Demographics by Unemployment Among Ages 45 to 54 years
Demographics Similar to Armenians by Unemployment Among Ages 45 to 54 years
In terms of unemployment among ages 45 to 54 years, the demographic groups most similar to Armenians are Immigrants from Portugal (5.2%, a difference of 0.0%), Immigrants from Haiti (5.2%, a difference of 0.17%), Trinidadian and Tobagonian (5.2%, a difference of 0.24%), Immigrants from Senegal (5.2%, a difference of 0.25%), and Immigrants from Caribbean (5.2%, a difference of 0.56%).
| Demographics | Rating | Rank | Unemployment Among Ages 45 to 54 years |
| Kiowa | 0.0 /100 | #284 | Tragic 5.1% |
| Iroquois | 0.0 /100 | #285 | Tragic 5.1% |
| Senegalese | 0.0 /100 | #286 | Tragic 5.1% |
| Haitians | 0.0 /100 | #287 | Tragic 5.2% |
| Immigrants | Caribbean | 0.0 /100 | #288 | Tragic 5.2% |
| Immigrants | Haiti | 0.0 /100 | #289 | Tragic 5.2% |
| Immigrants | Portugal | 0.0 /100 | #290 | Tragic 5.2% |
| Armenians | 0.0 /100 | #291 | Tragic 5.2% |
| Trinidadians and Tobagonians | 0.0 /100 | #292 | Tragic 5.2% |
| Immigrants | Senegal | 0.0 /100 | #293 | Tragic 5.2% |
| Belizeans | 0.0 /100 | #294 | Tragic 5.2% |
| Jamaicans | 0.0 /100 | #295 | Tragic 5.3% |
| Aleuts | 0.0 /100 | #296 | Tragic 5.3% |
| West Indians | 0.0 /100 | #297 | Tragic 5.3% |
| Immigrants | Trinidad and Tobago | 0.0 /100 | #298 | Tragic 5.3% |
Demographics Similar to Immigrants from Belarus by Unemployment Among Ages 45 to 54 years
In terms of unemployment among ages 45 to 54 years, the demographic groups most similar to Immigrants from Belarus are Albanian (4.6%, a difference of 0.020%), Estonian (4.6%, a difference of 0.030%), Peruvian (4.6%, a difference of 0.050%), South American (4.6%, a difference of 0.12%), and Immigrants from Lithuania (4.6%, a difference of 0.14%).
| Demographics | Rating | Rank | Unemployment Among Ages 45 to 54 years |
| Immigrants | Uruguay | 34.4 /100 | #191 | Fair 4.6% |
| Immigrants | Thailand | 34.1 /100 | #192 | Fair 4.6% |
| Immigrants | Lithuania | 33.2 /100 | #193 | Fair 4.6% |
| South Americans | 32.9 /100 | #194 | Fair 4.6% |
| Peruvians | 31.5 /100 | #195 | Fair 4.6% |
| Estonians | 31.2 /100 | #196 | Fair 4.6% |
| Albanians | 31.1 /100 | #197 | Fair 4.6% |
| Immigrants | Belarus | 30.6 /100 | #198 | Fair 4.6% |
| Brazilians | 20.1 /100 | #199 | Fair 4.6% |
| Immigrants | Denmark | 19.8 /100 | #200 | Poor 4.6% |
| Immigrants | Costa Rica | 19.7 /100 | #201 | Poor 4.6% |
| Immigrants | Peru | 19.1 /100 | #202 | Poor 4.6% |
| Liberians | 18.7 /100 | #203 | Poor 4.6% |
| Immigrants | Morocco | 16.8 /100 | #204 | Poor 4.6% |
| Immigrants | Greece | 16.2 /100 | #205 | Poor 4.6% |