Armenian vs Cree Unemployment Among Youth under 25 years
COMPARE
Armenian
Cree
Unemployment Among Youth under 25 years
Unemployment Among Youth under 25 years Comparison
Armenians
Cree
13.3%
UNEMPLOYMENT AMONG YOUTH UNDER 25 YEARS
0.0/ 100
METRIC RATING
281st/ 347
METRIC RANK
12.4%
UNEMPLOYMENT AMONG YOUTH UNDER 25 YEARS
0.1/ 100
METRIC RATING
263rd/ 347
METRIC RANK
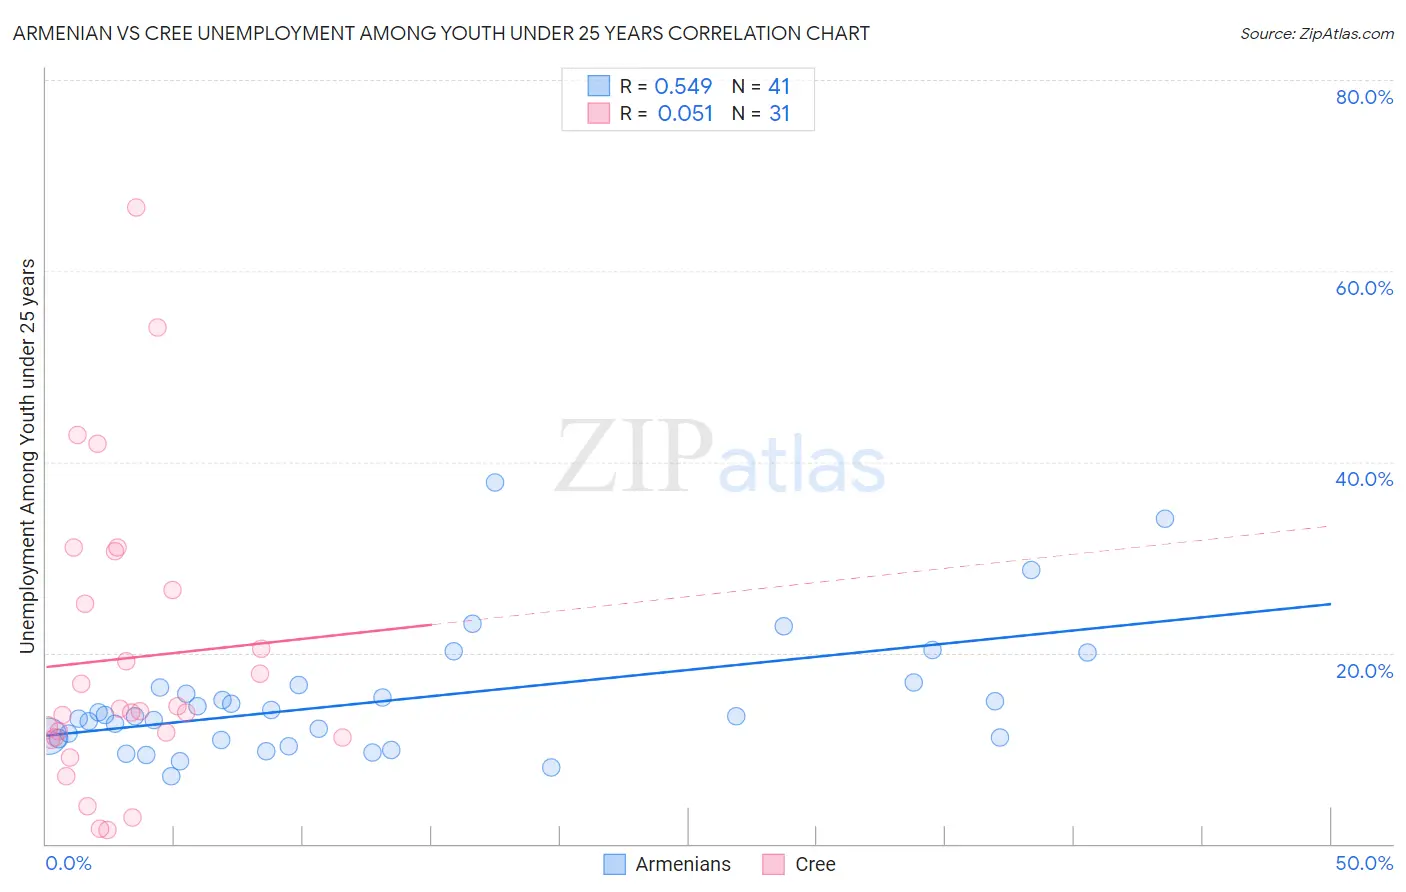
Armenian vs Cree Unemployment Among Youth under 25 years Correlation Chart
The statistical analysis conducted on geographies consisting of 307,706,627 people shows a substantial positive correlation between the proportion of Armenians and unemployment rate among youth under the age of 25 in the United States with a correlation coefficient (R) of 0.549 and weighted average of 13.3%. Similarly, the statistical analysis conducted on geographies consisting of 75,921,108 people shows a slight positive correlation between the proportion of Cree and unemployment rate among youth under the age of 25 in the United States with a correlation coefficient (R) of 0.051 and weighted average of 12.4%, a difference of 6.7%.
Unemployment Among Youth under 25 years Correlation Summary
| Measurement | Armenian | Cree |
| Minimum | 7.1% | 1.5% |
| Maximum | 37.8% | 66.6% |
| Range | 30.7% | 65.1% |
| Mean | 15.0% | 19.4% |
| Median | 13.3% | 13.9% |
| Interquartile 25% (IQ1) | 10.9% | 11.1% |
| Interquartile 75% (IQ3) | 16.5% | 26.6% |
| Interquartile Range (IQR) | 5.6% | 15.5% |
| Standard Deviation (Sample) | 6.6% | 15.2% |
| Standard Deviation (Population) | 6.5% | 15.0% |
Demographics Similar to Armenians and Cree by Unemployment Among Youth under 25 years
In terms of unemployment among youth under 25 years, the demographic groups most similar to Armenians are Sierra Leonean (13.3%, a difference of 0.010%), Ute (13.3%, a difference of 0.030%), Cajun (13.2%, a difference of 0.28%), African (13.2%, a difference of 0.95%), and Bahamian (13.1%, a difference of 1.2%). Similarly, the demographic groups most similar to Cree are Immigrants from Mexico (12.4%, a difference of 0.090%), Puget Sound Salish (12.5%, a difference of 0.47%), Nepalese (12.5%, a difference of 0.57%), Immigrants from Latin America (12.6%, a difference of 1.5%), and Subsaharan African (12.6%, a difference of 1.6%).
| Demographics | Rating | Rank | Unemployment Among Youth under 25 years |
| Immigrants | Mexico | 0.1 /100 | #262 | Tragic 12.4% |
| Cree | 0.1 /100 | #263 | Tragic 12.4% |
| Puget Sound Salish | 0.1 /100 | #264 | Tragic 12.5% |
| Nepalese | 0.0 /100 | #265 | Tragic 12.5% |
| Immigrants | Latin America | 0.0 /100 | #266 | Tragic 12.6% |
| Sub-Saharan Africans | 0.0 /100 | #267 | Tragic 12.6% |
| Tlingit-Haida | 0.0 /100 | #268 | Tragic 12.7% |
| Kiowa | 0.0 /100 | #269 | Tragic 12.7% |
| Immigrants | Liberia | 0.0 /100 | #270 | Tragic 12.8% |
| Immigrants | Bahamas | 0.0 /100 | #271 | Tragic 12.9% |
| Cape Verdeans | 0.0 /100 | #272 | Tragic 12.9% |
| Nigerians | 0.0 /100 | #273 | Tragic 13.0% |
| Immigrants | Nigeria | 0.0 /100 | #274 | Tragic 13.0% |
| Bermudans | 0.0 /100 | #275 | Tragic 13.0% |
| Immigrants | Uzbekistan | 0.0 /100 | #276 | Tragic 13.1% |
| Bahamians | 0.0 /100 | #277 | Tragic 13.1% |
| Africans | 0.0 /100 | #278 | Tragic 13.2% |
| Cajuns | 0.0 /100 | #279 | Tragic 13.2% |
| Ute | 0.0 /100 | #280 | Tragic 13.3% |
| Armenians | 0.0 /100 | #281 | Tragic 13.3% |
| Sierra Leoneans | 0.0 /100 | #282 | Tragic 13.3% |