Armenian vs Colombian Unemployment Among Ages 65 to 74 years

COMPARE

Armenian
Race
Ancestry
AfghanAfricanAlaska NativeAlaskan AthabascanAlbanianAleutAlsatianAmericanApacheArabArapahoArgentineanArmenianAssyrian/Chaldean/SyriacAustralianAustrianBahamianBangladeshiBarbadianBasqueBelgianBelizeanBermudanBhutaneseBlackfeetBolivianBrazilianBritishBritish West IndianBulgarianBurmeseCajunCambodianCanadianCape VerdeanCarpatho RusynCelticCentral AmericanCentral American IndianCherokeeCheyenneChickasawChileanChineseChippewaChoctawColvilleComancheCosta RicanCreeCreekCroatianCrowCubanCypriotCzechCzechoslovakianDanishDelawareDominicanDutchDutch West IndianEastern EuropeanEcuadorianEgyptianEnglishEstonianEthiopianEuropeanFijianFilipinoFinnishFrenchFrench American IndianFrench CanadianGermanGerman RussianGhanaianGreekGuamanian/ChamorroGuatemalanGuyaneseHaitianHmongHonduranHopiHoumaHungarianIcelanderIndian (Asian)IndonesianInupiatIranianIraqiIrishIroquoisIsraeliItalianJamaicanJapaneseJordanianKenyanKiowaKoreanLaotianLatvianLebaneseLiberianLithuanianLumbeeLuxembourgerMacedonianMalaysianMalteseMarshalleseMenomineeMexicanMexican American IndianMongolianMoroccanNative HawaiianNavajoNepaleseNew ZealanderNicaraguanNigerianNorthern EuropeanNorwegianOkinawanOsageOttawaPaiutePakistaniPalestinianPanamanianParaguayanPennsylvania GermanPeruvianPimaPolishPortuguesePotawatomiPuebloPuerto RicanPuget Sound SalishRomanianRussianSalvadoranSamoanScandinavianScotch-IrishScottishSeminoleSenegaleseSerbianShoshoneSierra LeoneanSiouxSlavicSlovakSloveneSomaliSouth AfricanSouth AmericanSouth American IndianSoviet UnionSpaniardSpanishSpanish AmericanSpanish American IndianSri LankanSubsaharan AfricanSudaneseSwedishSwissSyrianTaiwaneseThaiTlingit-HaidaTohono O'OdhamTonganTrinidadian and TobagonianTsimshianTurkishU.S. Virgin IslanderUgandanUkrainianUruguayanUteVenezuelanVietnameseWelshWest IndianYakamaYaquiYugoslavianYumanYup'ikZimbabwean
Immigration
NonimmigrantsImmigrantsAfghanistanAfricaAlbaniaArgentinaArmeniaAsiaAustraliaAustriaBahamasBangladeshBarbadosBelarusBelgiumBelizeBoliviaBosnia and HerzegovinaBrazilBulgariaBurma/MyanmarCabo VerdeCambodiaCameroonCanadaCaribbeanCentral AmericaChileChinaColombiaCongoCosta RicaCroatiaCubaCzechoslovakiaDenmarkDominicaDominican RepublicEastern AfricaEastern AsiaEastern EuropeEcuadorEgyptEl SalvadorEnglandEritreaEthiopiaEuropeFijiFranceGermanyGhanaGreeceGrenadaGuatemalaGuyanaHaitiHondurasHong KongHungaryIndiaIndonesiaIranIraqIrelandIsraelItalyJamaicaJapanJordanKazakhstanKenyaKoreaKuwaitLaosLatin AmericaLatviaLebanonLiberiaLithuaniaMalaysiaMexicoMicronesiaMiddle AfricaMoldovaMoroccoNepalNetherlandsNicaraguaNigeriaNorth AmericaNorth MacedoniaNorthern AfricaNorthern EuropeNorwayOceaniaPakistanPanamaPeruPhilippinesPolandPortugalRomaniaRussiaSaudi ArabiaScotlandSenegalSerbiaSierra LeoneSingaporeSomaliaSouth AfricaSouth AmericaSouth Central AsiaSouth Eastern AsiaSouthern EuropeSpainSri LankaSt. Vincent and the GrenadinesSudanSwedenSwitzerlandSyriaTaiwanThailandTrinidad and TobagoTurkeyUgandaUkraineUruguayUzbekistanVenezuelaVietnamWest IndiesWestern AfricaWestern AsiaWestern EuropeYemenZaireZimbabweAzores
Colombian
Race
Ancestry
AfghanAfricanAlaska NativeAlaskan AthabascanAlbanianAleutAlsatianAmericanApacheArabArapahoArgentineanAssyrian/Chaldean/SyriacAustralianAustrianBahamianBangladeshiBarbadianBasqueBelgianBelizeanBermudanBhutaneseBlackfeetBolivianBrazilianBritishBritish West IndianBulgarianBurmeseCajunCambodianCanadianCape VerdeanCarpatho RusynCelticCentral AmericanCentral American IndianCherokeeCheyenneChickasawChileanChineseChippewaChoctawColombianColvilleComancheCosta RicanCreeCreekCroatianCrowCubanCypriotCzechCzechoslovakianDanishDelawareDominicanDutchDutch West IndianEastern EuropeanEcuadorianEgyptianEnglishEstonianEthiopianEuropeanFijianFilipinoFinnishFrenchFrench American IndianFrench CanadianGermanGerman RussianGhanaianGreekGuamanian/ChamorroGuatemalanGuyaneseHaitianHmongHonduranHopiHoumaHungarianIcelanderIndian (Asian)IndonesianInupiatIranianIraqiIrishIroquoisIsraeliItalianJamaicanJapaneseJordanianKenyanKiowaKoreanLaotianLatvianLebaneseLiberianLithuanianLumbeeLuxembourgerMacedonianMalaysianMalteseMarshalleseMenomineeMexicanMexican American IndianMongolianMoroccanNative HawaiianNavajoNepaleseNew ZealanderNicaraguanNigerianNorthern EuropeanNorwegianOkinawanOsageOttawaPaiutePakistaniPalestinianPanamanianParaguayanPennsylvania GermanPeruvianPimaPolishPortuguesePotawatomiPuebloPuerto RicanPuget Sound SalishRomanianRussianSalvadoranSamoanScandinavianScotch-IrishScottishSeminoleSenegaleseSerbianShoshoneSierra LeoneanSiouxSlavicSlovakSloveneSomaliSouth AfricanSouth AmericanSouth American IndianSoviet UnionSpaniardSpanishSpanish AmericanSpanish American IndianSri LankanSubsaharan AfricanSudaneseSwedishSwissSyrianTaiwaneseThaiTlingit-HaidaTohono O'OdhamTonganTrinidadian and TobagonianTsimshianTurkishU.S. Virgin IslanderUgandanUkrainianUruguayanUteVenezuelanVietnameseWelshWest IndianYakamaYaquiYugoslavianYumanYup'ikZimbabwean
Immigration
NonimmigrantsImmigrantsAfghanistanAfricaAlbaniaArgentinaArmeniaAsiaAustraliaAustriaBahamasBangladeshBarbadosBelarusBelgiumBelizeBoliviaBosnia and HerzegovinaBrazilBulgariaBurma/MyanmarCabo VerdeCambodiaCameroonCanadaCaribbeanCentral AmericaChileChinaColombiaCongoCosta RicaCroatiaCubaCzechoslovakiaDenmarkDominicaDominican RepublicEastern AfricaEastern AsiaEastern EuropeEcuadorEgyptEl SalvadorEnglandEritreaEthiopiaEuropeFijiFranceGermanyGhanaGreeceGrenadaGuatemalaGuyanaHaitiHondurasHong KongHungaryIndiaIndonesiaIranIraqIrelandIsraelItalyJamaicaJapanJordanKazakhstanKenyaKoreaKuwaitLaosLatin AmericaLatviaLebanonLiberiaLithuaniaMalaysiaMexicoMicronesiaMiddle AfricaMoldovaMoroccoNepalNetherlandsNicaraguaNigeriaNorth AmericaNorth MacedoniaNorthern AfricaNorthern EuropeNorwayOceaniaPakistanPanamaPeruPhilippinesPolandPortugalRomaniaRussiaSaudi ArabiaScotlandSenegalSerbiaSierra LeoneSingaporeSomaliaSouth AfricaSouth AmericaSouth Central AsiaSouth Eastern AsiaSouthern EuropeSpainSri LankaSt. Vincent and the GrenadinesSudanSwedenSwitzerlandSyriaTaiwanThailandTrinidad and TobagoTurkeyUgandaUkraineUruguayUzbekistanVenezuelaVietnamWest IndiesWestern AfricaWestern AsiaWestern EuropeYemenZaireZimbabweAzores
Unemployment Among Ages 65 to 74 years
Income
Poverty
Unemployment
Labor Participation
Family Structure
Vehicle Availability
Education Level
Disability

Unemployment Among Ages 65 to 74 years Comparison

Armenians

Colombians

Tragic
Tragic
5.8%
UNEMPLOYMENT AMONG AGES 65 TO 74 YEARS
0.0/ 100
METRIC RATING
301st/ 347
METRIC RANK
5.6%
UNEMPLOYMENT AMONG AGES 65 TO 74 YEARS
0.5/ 100
METRIC RATING
252nd/ 347
METRIC RANK

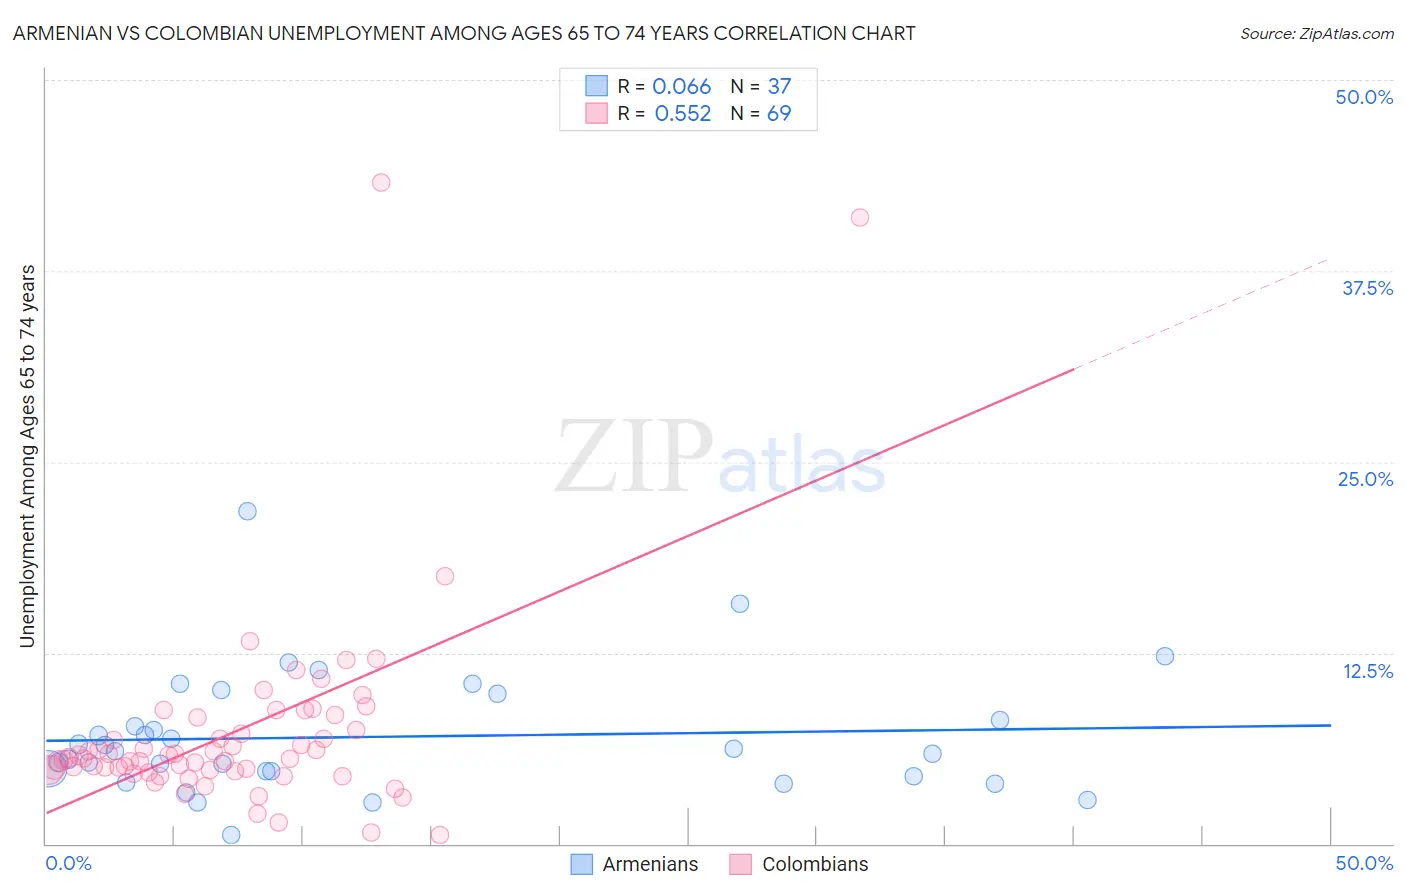
Armenian vs Colombian Unemployment Among Ages 65 to 74 years Correlation Chart

The statistical analysis conducted on geographies consisting of 282,681,828 people shows a slight positive correlation between the proportion of Armenians and unemployment rate among population between the ages 65 and 74 in the United States with a correlation coefficient (R) of 0.066 and weighted average of 5.8%. Similarly, the statistical analysis conducted on geographies consisting of 369,038,352 people shows a substantial positive correlation between the proportion of Colombians and unemployment rate among population between the ages 65 and 74 in the United States with a correlation coefficient (R) of 0.552 and weighted average of 5.6%, a difference of 4.0%.
Armenian vs Colombian Unemployment Among Ages 65 to 74 years

Unemployment Among Ages 65 to 74 years Correlation Summary

MeasurementArmenianColombian
Minimum0.60%0.60%
Maximum21.8%43.3%
Range21.2%42.7%
Mean7.0%7.2%
Median6.1%5.6%
Interquartile 25% (IQ1)4.6%4.8%
Interquartile 75% (IQ3)8.9%7.9%
Interquartile Range (IQR)4.4%3.1%
Standard Deviation (Sample)4.0%6.7%
Standard Deviation (Population)4.0%6.7%

Similar Demographics by Unemployment Among Ages 65 to 74 years

Demographics Similar to Armenians by Unemployment Among Ages 65 to 74 years

In terms of unemployment among ages 65 to 74 years, the demographic groups most similar to Armenians are Ecuadorian (5.8%, a difference of 0.11%), Immigrants from Latin America (5.8%, a difference of 0.12%), Barbadian (5.8%, a difference of 0.12%), Liberian (5.8%, a difference of 0.12%), and Arapaho (5.8%, a difference of 0.15%).
DemographicsRating | RankUnemployment Among Ages 65 to 74 years
Immigrants | Morocco
0.0
/100
|
#294
Tragic
5.8%
Blacks/African Americans
0.0
/100
|
#295
Tragic
5.8%
Pennsylvania Germans
0.0
/100
|
#296
Tragic
5.8%
Houma
0.0
/100
|
#297
Tragic
5.8%
Immigrants | Latin America
0.0
/100
|
#298
Tragic
5.8%
Barbadians
0.0
/100
|
#299
Tragic
5.8%
Ecuadorians
0.0
/100
|
#300
Tragic
5.8%
Armenians
0.0
/100
|
#301
Tragic
5.8%
Liberians
0.0
/100
|
#302
Tragic
5.8%
Arapaho
0.0
/100
|
#303
Tragic
5.8%
Salvadorans
0.0
/100
|
#304
Tragic
5.8%
Mexicans
0.0
/100
|
#305
Tragic
5.8%
Cheyenne
0.0
/100
|
#306
Tragic
5.8%
British West Indians
0.0
/100
|
#307
Tragic
5.8%
Guatemalans
0.0
/100
|
#308
Tragic
5.8%

Demographics Similar to Colombians by Unemployment Among Ages 65 to 74 years

In terms of unemployment among ages 65 to 74 years, the demographic groups most similar to Colombians are Brazilian (5.6%, a difference of 0.040%), Immigrants from Brazil (5.6%, a difference of 0.060%), Immigrants from Costa Rica (5.6%, a difference of 0.080%), Immigrants from Haiti (5.6%, a difference of 0.17%), and Native Hawaiian (5.6%, a difference of 0.27%).
DemographicsRating | RankUnemployment Among Ages 65 to 74 years
Immigrants | Greece
0.9
/100
|
#245
Tragic
5.6%
Paraguayans
0.9
/100
|
#246
Tragic
5.6%
Immigrants | Immigrants
0.9
/100
|
#247
Tragic
5.6%
Immigrants | Argentina
0.9
/100
|
#248
Tragic
5.6%
Trinidadians and Tobagonians
0.8
/100
|
#249
Tragic
5.6%
Cape Verdeans
0.7
/100
|
#250
Tragic
5.6%
Brazilians
0.5
/100
|
#251
Tragic
5.6%
Colombians
0.5
/100
|
#252
Tragic
5.6%
Immigrants | Brazil
0.5
/100
|
#253
Tragic
5.6%
Immigrants | Costa Rica
0.5
/100
|
#254
Tragic
5.6%
Immigrants | Haiti
0.4
/100
|
#255
Tragic
5.6%
Native Hawaiians
0.4
/100
|
#256
Tragic
5.6%
Immigrants | Southern Europe
0.3
/100
|
#257
Tragic
5.6%
Immigrants | Western Africa
0.3
/100
|
#258
Tragic
5.6%
Sierra Leoneans
0.2
/100
|
#259
Tragic
5.6%