Arab vs Immigrants from Ethiopia Unemployment Among Ages 25 to 29 years

COMPARE

Arab
Race
Ancestry
AfghanAfricanAlaska NativeAlaskan AthabascanAlbanianAleutAlsatianAmericanApacheArabArapahoArgentineanArmenianAssyrian/Chaldean/SyriacAustralianAustrianBahamianBangladeshiBarbadianBasqueBelgianBelizeanBermudanBhutaneseBlackfeetBolivianBrazilianBritishBritish West IndianBulgarianBurmeseCajunCambodianCanadianCape VerdeanCarpatho RusynCelticCentral AmericanCentral American IndianCherokeeCheyenneChickasawChileanChineseChippewaChoctawColombianColvilleComancheCosta RicanCreeCreekCroatianCrowCubanCypriotCzechCzechoslovakianDanishDelawareDominicanDutchDutch West IndianEastern EuropeanEcuadorianEgyptianEnglishEstonianEthiopianEuropeanFijianFilipinoFinnishFrenchFrench American IndianFrench CanadianGermanGerman RussianGhanaianGreekGuamanian/ChamorroGuatemalanGuyaneseHaitianHmongHonduranHopiHoumaHungarianIcelanderIndian (Asian)IndonesianInupiatIranianIraqiIrishIroquoisIsraeliItalianJamaicanJapaneseJordanianKenyanKiowaKoreanLaotianLatvianLebaneseLiberianLithuanianLumbeeLuxembourgerMacedonianMalaysianMalteseMarshalleseMenomineeMexicanMexican American IndianMongolianMoroccanNative HawaiianNavajoNepaleseNew ZealanderNicaraguanNigerianNorthern EuropeanNorwegianOkinawanOsageOttawaPaiutePakistaniPalestinianPanamanianParaguayanPennsylvania GermanPeruvianPimaPolishPortuguesePotawatomiPuebloPuerto RicanPuget Sound SalishRomanianRussianSalvadoranSamoanScandinavianScotch-IrishScottishSeminoleSenegaleseSerbianShoshoneSierra LeoneanSiouxSlavicSlovakSloveneSomaliSouth AfricanSouth AmericanSouth American IndianSoviet UnionSpaniardSpanishSpanish AmericanSpanish American IndianSri LankanSubsaharan AfricanSudaneseSwedishSwissSyrianTaiwaneseThaiTlingit-HaidaTohono O'OdhamTonganTrinidadian and TobagonianTsimshianTurkishU.S. Virgin IslanderUgandanUkrainianUruguayanUteVenezuelanVietnameseWelshWest IndianYakamaYaquiYugoslavianYumanYup'ikZimbabwean
Immigration
NonimmigrantsImmigrantsAfghanistanAfricaAlbaniaArgentinaArmeniaAsiaAustraliaAustriaBahamasBangladeshBarbadosBelarusBelgiumBelizeBoliviaBosnia and HerzegovinaBrazilBulgariaBurma/MyanmarCabo VerdeCambodiaCameroonCanadaCaribbeanCentral AmericaChileChinaColombiaCongoCosta RicaCroatiaCubaCzechoslovakiaDenmarkDominicaDominican RepublicEastern AfricaEastern AsiaEastern EuropeEcuadorEgyptEl SalvadorEnglandEritreaEuropeFijiFranceGermanyGhanaGreeceGrenadaGuatemalaGuyanaHaitiHondurasHong KongHungaryIndiaIndonesiaIranIraqIrelandIsraelItalyJamaicaJapanJordanKazakhstanKenyaKoreaKuwaitLaosLatin AmericaLatviaLebanonLiberiaLithuaniaMalaysiaMexicoMicronesiaMiddle AfricaMoldovaMoroccoNepalNetherlandsNicaraguaNigeriaNorth AmericaNorth MacedoniaNorthern AfricaNorthern EuropeNorwayOceaniaPakistanPanamaPeruPhilippinesPolandPortugalRomaniaRussiaSaudi ArabiaScotlandSenegalSerbiaSierra LeoneSingaporeSomaliaSouth AfricaSouth AmericaSouth Central AsiaSouth Eastern AsiaSouthern EuropeSpainSri LankaSt. Vincent and the GrenadinesSudanSwedenSwitzerlandSyriaTaiwanThailandTrinidad and TobagoTurkeyUgandaUkraineUruguayUzbekistanVenezuelaVietnamWest IndiesWestern AfricaWestern AsiaWestern EuropeYemenZaireZimbabweAzores
Immigrants from Ethiopia
Race
Ancestry
AfghanAfricanAlaska NativeAlaskan AthabascanAlbanianAleutAlsatianAmericanApacheArapahoArgentineanArmenianAssyrian/Chaldean/SyriacAustralianAustrianBahamianBangladeshiBarbadianBasqueBelgianBelizeanBermudanBhutaneseBlackfeetBolivianBrazilianBritishBritish West IndianBulgarianBurmeseCajunCambodianCanadianCape VerdeanCarpatho RusynCelticCentral AmericanCentral American IndianCherokeeCheyenneChickasawChileanChineseChippewaChoctawColombianColvilleComancheCosta RicanCreeCreekCroatianCrowCubanCypriotCzechCzechoslovakianDanishDelawareDominicanDutchDutch West IndianEastern EuropeanEcuadorianEgyptianEnglishEstonianEthiopianEuropeanFijianFilipinoFinnishFrenchFrench American IndianFrench CanadianGermanGerman RussianGhanaianGreekGuamanian/ChamorroGuatemalanGuyaneseHaitianHmongHonduranHopiHoumaHungarianIcelanderIndian (Asian)IndonesianInupiatIranianIraqiIrishIroquoisIsraeliItalianJamaicanJapaneseJordanianKenyanKiowaKoreanLaotianLatvianLebaneseLiberianLithuanianLumbeeLuxembourgerMacedonianMalaysianMalteseMarshalleseMenomineeMexicanMexican American IndianMongolianMoroccanNative HawaiianNavajoNepaleseNew ZealanderNicaraguanNigerianNorthern EuropeanNorwegianOkinawanOsageOttawaPaiutePakistaniPalestinianPanamanianParaguayanPennsylvania GermanPeruvianPimaPolishPortuguesePotawatomiPuebloPuerto RicanPuget Sound SalishRomanianRussianSalvadoranSamoanScandinavianScotch-IrishScottishSeminoleSenegaleseSerbianShoshoneSierra LeoneanSiouxSlavicSlovakSloveneSomaliSouth AfricanSouth AmericanSouth American IndianSoviet UnionSpaniardSpanishSpanish AmericanSpanish American IndianSri LankanSubsaharan AfricanSudaneseSwedishSwissSyrianTaiwaneseThaiTlingit-HaidaTohono O'OdhamTonganTrinidadian and TobagonianTsimshianTurkishU.S. Virgin IslanderUgandanUkrainianUruguayanUteVenezuelanVietnameseWelshWest IndianYakamaYaquiYugoslavianYumanYup'ikZimbabwean
Immigration
NonimmigrantsImmigrantsAfghanistanAfricaAlbaniaArgentinaArmeniaAsiaAustraliaAustriaBahamasBangladeshBarbadosBelarusBelgiumBelizeBoliviaBosnia and HerzegovinaBrazilBulgariaBurma/MyanmarCabo VerdeCambodiaCameroonCanadaCaribbeanCentral AmericaChileChinaColombiaCongoCosta RicaCroatiaCubaCzechoslovakiaDenmarkDominicaDominican RepublicEastern AfricaEastern AsiaEastern EuropeEcuadorEgyptEl SalvadorEnglandEritreaEthiopiaEuropeFijiFranceGermanyGhanaGreeceGrenadaGuatemalaGuyanaHaitiHondurasHong KongHungaryIndiaIndonesiaIranIraqIrelandIsraelItalyJamaicaJapanJordanKazakhstanKenyaKoreaKuwaitLaosLatin AmericaLatviaLebanonLiberiaLithuaniaMalaysiaMexicoMicronesiaMiddle AfricaMoldovaMoroccoNepalNetherlandsNicaraguaNigeriaNorth AmericaNorth MacedoniaNorthern AfricaNorthern EuropeNorwayOceaniaPakistanPanamaPeruPhilippinesPolandPortugalRomaniaRussiaSaudi ArabiaScotlandSenegalSerbiaSierra LeoneSingaporeSomaliaSouth AfricaSouth AmericaSouth Central AsiaSouth Eastern AsiaSouthern EuropeSpainSri LankaSt. Vincent and the GrenadinesSudanSwedenSwitzerlandSyriaTaiwanThailandTrinidad and TobagoTurkeyUgandaUkraineUruguayUzbekistanVenezuelaVietnamWest IndiesWestern AfricaWestern AsiaWestern EuropeYemenZaireZimbabweAzores
Unemployment Among Ages 25 to 29 years
Income
Poverty
Unemployment
Labor Participation
Family Structure
Vehicle Availability
Education Level
Disability

Unemployment Among Ages 25 to 29 years Comparison

Arabs

Immigrants from Ethiopia

Excellent
Exceptional
6.5%
UNEMPLOYMENT AMONG AGES 25 TO 29 YEARS
82.5/ 100
METRIC RATING
124th/ 347
METRIC RANK
6.0%
UNEMPLOYMENT AMONG AGES 25 TO 29 YEARS
99.9/ 100
METRIC RATING
21st/ 347
METRIC RANK

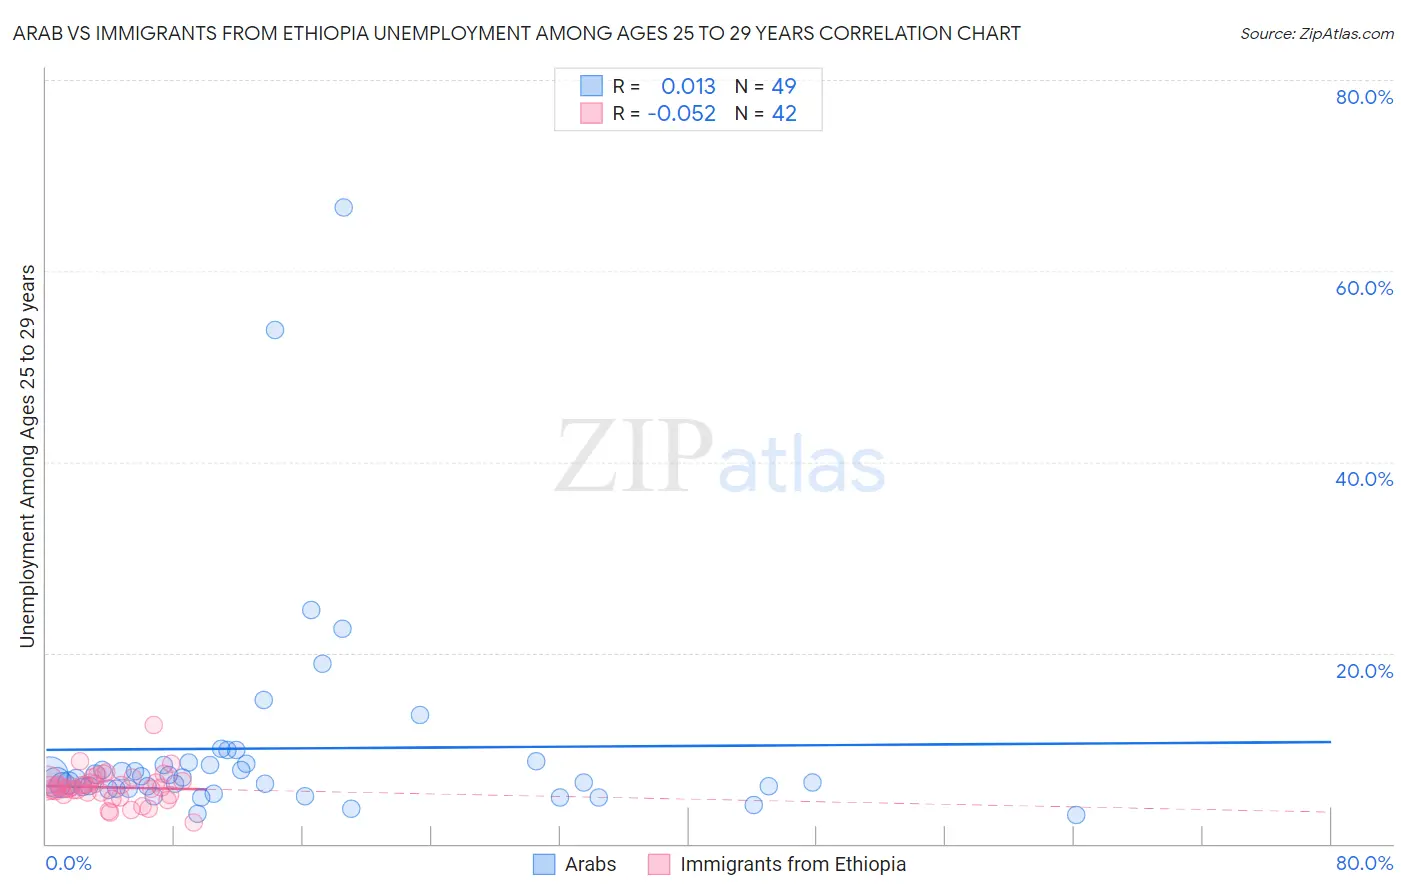
Arab vs Immigrants from Ethiopia Unemployment Among Ages 25 to 29 years Correlation Chart

The statistical analysis conducted on geographies consisting of 454,763,852 people shows no correlation between the proportion of Arabs and unemployment rate among population between the ages 25 and 29 in the United States with a correlation coefficient (R) of 0.013 and weighted average of 6.5%. Similarly, the statistical analysis conducted on geographies consisting of 206,943,283 people shows a slight negative correlation between the proportion of Immigrants from Ethiopia and unemployment rate among population between the ages 25 and 29 in the United States with a correlation coefficient (R) of -0.052 and weighted average of 6.0%, a difference of 8.8%.
Arab vs Immigrants from Ethiopia Unemployment Among Ages 25 to 29 years

Unemployment Among Ages 25 to 29 years Correlation Summary

MeasurementArabImmigrants from Ethiopia
Minimum3.0%2.2%
Maximum66.7%12.5%
Range63.7%10.3%
Mean10.0%5.9%
Median6.8%5.9%
Interquartile 25% (IQ1)5.8%5.1%
Interquartile 75% (IQ3)8.4%6.4%
Interquartile Range (IQR)2.6%1.3%
Standard Deviation (Sample)11.4%1.7%
Standard Deviation (Population)11.3%1.7%

Similar Demographics by Unemployment Among Ages 25 to 29 years

Demographics Similar to Arabs by Unemployment Among Ages 25 to 29 years

In terms of unemployment among ages 25 to 29 years, the demographic groups most similar to Arabs are Syrian (6.5%, a difference of 0.040%), Brazilian (6.5%, a difference of 0.060%), Laotian (6.5%, a difference of 0.12%), Immigrants from Belarus (6.5%, a difference of 0.14%), and Dutch (6.5%, a difference of 0.19%).
DemographicsRating | RankUnemployment Among Ages 25 to 29 years
Immigrants | Uruguay
85.7
/100
|
#117
Excellent
6.5%
Chileans
85.3
/100
|
#118
Excellent
6.5%
Immigrants | South Africa
84.9
/100
|
#119
Excellent
6.5%
Immigrants | Moldova
84.5
/100
|
#120
Excellent
6.5%
Immigrants | Uganda
84.5
/100
|
#121
Excellent
6.5%
Immigrants | Belarus
83.7
/100
|
#122
Excellent
6.5%
Laotians
83.6
/100
|
#123
Excellent
6.5%
Arabs
82.5
/100
|
#124
Excellent
6.5%
Syrians
82.1
/100
|
#125
Excellent
6.5%
Brazilians
81.9
/100
|
#126
Excellent
6.5%
Dutch
80.6
/100
|
#127
Excellent
6.5%
Immigrants | Chile
80.5
/100
|
#128
Excellent
6.5%
Sri Lankans
80.3
/100
|
#129
Excellent
6.5%
Immigrants | Peru
79.9
/100
|
#130
Good
6.5%
Immigrants | Afghanistan
79.2
/100
|
#131
Good
6.5%

Demographics Similar to Immigrants from Ethiopia by Unemployment Among Ages 25 to 29 years

In terms of unemployment among ages 25 to 29 years, the demographic groups most similar to Immigrants from Ethiopia are Immigrants from Japan (6.0%, a difference of 0.27%), Immigrants from Venezuela (6.0%, a difference of 0.33%), Immigrants from Eritrea (5.9%, a difference of 0.34%), Norwegian (6.0%, a difference of 0.38%), and Thai (5.9%, a difference of 0.53%).
DemographicsRating | RankUnemployment Among Ages 25 to 29 years
Immigrants | Kuwait
99.9
/100
|
#14
Exceptional
5.9%
Cubans
99.9
/100
|
#15
Exceptional
5.9%
Immigrants | Bulgaria
99.9
/100
|
#16
Exceptional
5.9%
Bolivians
99.9
/100
|
#17
Exceptional
5.9%
Immigrants | Singapore
99.9
/100
|
#18
Exceptional
5.9%
Thais
99.9
/100
|
#19
Exceptional
5.9%
Immigrants | Eritrea
99.9
/100
|
#20
Exceptional
5.9%
Immigrants | Ethiopia
99.9
/100
|
#21
Exceptional
6.0%
Immigrants | Japan
99.9
/100
|
#22
Exceptional
6.0%
Immigrants | Venezuela
99.8
/100
|
#23
Exceptional
6.0%
Norwegians
99.8
/100
|
#24
Exceptional
6.0%
New Zealanders
99.8
/100
|
#25
Exceptional
6.0%
Immigrants | Eastern Africa
99.8
/100
|
#26
Exceptional
6.0%
Immigrants | Zaire
99.7
/100
|
#27
Exceptional
6.0%
Danes
99.7
/100
|
#28
Exceptional
6.0%