Apache vs Immigrants from Eritrea Unemployment Among Ages 45 to 54 years
COMPARE
Apache
Immigrants from Eritrea
Unemployment Among Ages 45 to 54 years
Unemployment Among Ages 45 to 54 years Comparison
Apache
Immigrants from Eritrea
7.0%
UNEMPLOYMENT AMONG AGES 45 TO 54 YEARS
0.0/ 100
METRIC RATING
337th/ 347
METRIC RANK
4.4%
UNEMPLOYMENT AMONG AGES 45 TO 54 YEARS
94.7/ 100
METRIC RATING
100th/ 347
METRIC RANK
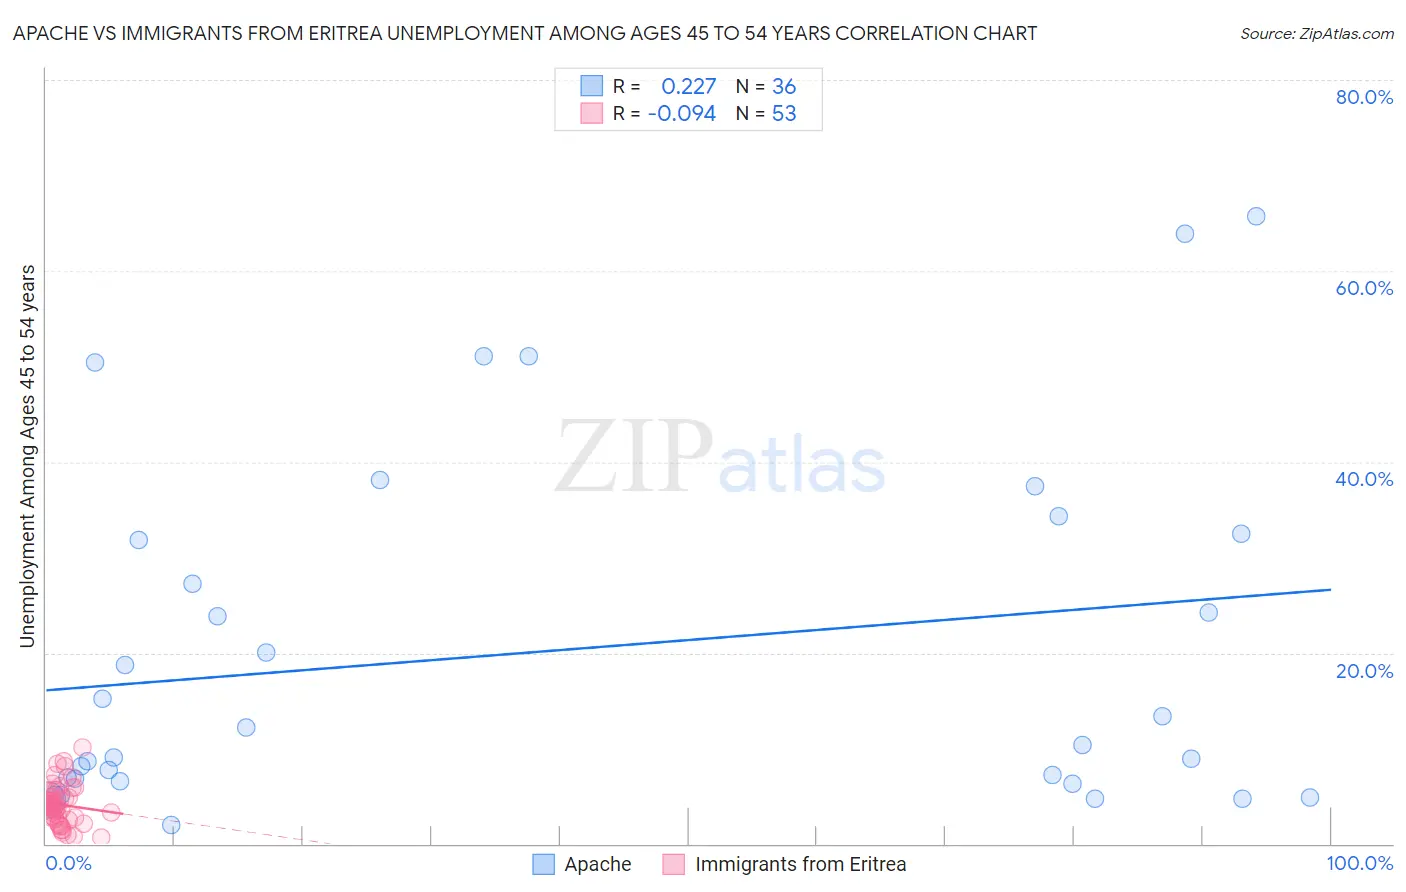
Apache vs Immigrants from Eritrea Unemployment Among Ages 45 to 54 years Correlation Chart
The statistical analysis conducted on geographies consisting of 227,022,431 people shows a weak positive correlation between the proportion of Apache and unemployment rate among population between the ages 45 and 54 in the United States with a correlation coefficient (R) of 0.227 and weighted average of 7.0%. Similarly, the statistical analysis conducted on geographies consisting of 104,558,577 people shows a slight negative correlation between the proportion of Immigrants from Eritrea and unemployment rate among population between the ages 45 and 54 in the United States with a correlation coefficient (R) of -0.094 and weighted average of 4.4%, a difference of 60.8%.
Unemployment Among Ages 45 to 54 years Correlation Summary
| Measurement | Apache | Immigrants from Eritrea |
| Minimum | 1.9% | 0.60% |
| Maximum | 65.7% | 10.0% |
| Range | 63.8% | 9.4% |
| Mean | 20.2% | 4.1% |
| Median | 11.3% | 4.0% |
| Interquartile 25% (IQ1) | 6.7% | 2.7% |
| Interquartile 75% (IQ3) | 32.1% | 5.0% |
| Interquartile Range (IQR) | 25.4% | 2.4% |
| Standard Deviation (Sample) | 18.2% | 2.1% |
| Standard Deviation (Population) | 17.9% | 2.1% |
Similar Demographics by Unemployment Among Ages 45 to 54 years
Demographics Similar to Apache by Unemployment Among Ages 45 to 54 years
In terms of unemployment among ages 45 to 54 years, the demographic groups most similar to Apache are Puerto Rican (6.8%, a difference of 3.4%), Colville (7.4%, a difference of 5.0%), Navajo (6.7%, a difference of 5.6%), Sioux (6.6%, a difference of 6.1%), and Arapaho (7.5%, a difference of 6.5%).
| Demographics | Rating | Rank | Unemployment Among Ages 45 to 54 years |
| Immigrants | Dominican Republic | 0.0 /100 | #330 | Tragic 6.3% |
| Tohono O'odham | 0.0 /100 | #331 | Tragic 6.3% |
| Pima | 0.0 /100 | #332 | Tragic 6.4% |
| Immigrants | Yemen | 0.0 /100 | #333 | Tragic 6.5% |
| Sioux | 0.0 /100 | #334 | Tragic 6.6% |
| Navajo | 0.0 /100 | #335 | Tragic 6.7% |
| Puerto Ricans | 0.0 /100 | #336 | Tragic 6.8% |
| Apache | 0.0 /100 | #337 | Tragic 7.0% |
| Colville | 0.0 /100 | #338 | Tragic 7.4% |
| Arapaho | 0.0 /100 | #339 | Tragic 7.5% |
| Hopi | 0.0 /100 | #340 | Tragic 7.5% |
| Paiute | 0.0 /100 | #341 | Tragic 7.8% |
| Alaskan Athabascans | 0.0 /100 | #342 | Tragic 8.5% |
| Inupiat | 0.0 /100 | #343 | Tragic 9.2% |
| Yuman | 0.0 /100 | #344 | Tragic 9.5% |
Demographics Similar to Immigrants from Eritrea by Unemployment Among Ages 45 to 54 years
In terms of unemployment among ages 45 to 54 years, the demographic groups most similar to Immigrants from Eritrea are Immigrants from Burma/Myanmar (4.4%, a difference of 0.030%), Romanian (4.4%, a difference of 0.050%), Immigrants from Canada (4.4%, a difference of 0.060%), Indonesian (4.4%, a difference of 0.18%), and Immigrants from North America (4.4%, a difference of 0.19%).
| Demographics | Rating | Rank | Unemployment Among Ages 45 to 54 years |
| Argentineans | 96.5 /100 | #93 | Exceptional 4.3% |
| Immigrants | Malaysia | 96.2 /100 | #94 | Exceptional 4.4% |
| Immigrants | Ethiopia | 96.1 /100 | #95 | Exceptional 4.4% |
| Indonesians | 95.4 /100 | #96 | Exceptional 4.4% |
| Immigrants | Canada | 95.0 /100 | #97 | Exceptional 4.4% |
| Romanians | 94.9 /100 | #98 | Exceptional 4.4% |
| Immigrants | Burma/Myanmar | 94.9 /100 | #99 | Exceptional 4.4% |
| Immigrants | Eritrea | 94.7 /100 | #100 | Exceptional 4.4% |
| Immigrants | North America | 93.9 /100 | #101 | Exceptional 4.4% |
| Sri Lankans | 93.7 /100 | #102 | Exceptional 4.4% |
| Icelanders | 93.5 /100 | #103 | Exceptional 4.4% |
| Immigrants | Sweden | 93.0 /100 | #104 | Exceptional 4.4% |
| Immigrants | Kenya | 92.8 /100 | #105 | Exceptional 4.4% |
| Iranians | 92.5 /100 | #106 | Exceptional 4.4% |
| Immigrants | South Africa | 92.5 /100 | #107 | Exceptional 4.4% |