Apache vs Carpatho Rusyn Unemployment Among Ages 30 to 34 years

COMPARE

Apache
Race
Ancestry
AfghanAfricanAlaska NativeAlaskan AthabascanAlbanianAleutAlsatianAmericanApacheArabArapahoArgentineanArmenianAssyrian/Chaldean/SyriacAustralianAustrianBahamianBangladeshiBarbadianBasqueBelgianBelizeanBermudanBhutaneseBlackfeetBolivianBrazilianBritishBritish West IndianBulgarianBurmeseCajunCambodianCanadianCape VerdeanCelticCentral AmericanCentral American IndianCherokeeCheyenneChickasawChileanChineseChippewaChoctawColombianColvilleComancheCosta RicanCreeCreekCroatianCrowCubanCypriotCzechCzechoslovakianDanishDelawareDominicanDutchDutch West IndianEastern EuropeanEcuadorianEgyptianEnglishEstonianEthiopianEuropeanFijianFilipinoFinnishFrenchFrench American IndianFrench CanadianGermanGerman RussianGhanaianGreekGuamanian/ChamorroGuatemalanGuyaneseHaitianHmongHonduranHopiHoumaHungarianIcelanderIndian (Asian)IndonesianInupiatIranianIraqiIrishIroquoisIsraeliItalianJamaicanJapaneseJordanianKenyanKiowaKoreanLaotianLatvianLebaneseLiberianLithuanianLumbeeLuxembourgerMacedonianMalaysianMalteseMarshalleseMenomineeMexicanMexican American IndianMongolianMoroccanNative HawaiianNavajoNepaleseNew ZealanderNicaraguanNigerianNorthern EuropeanNorwegianOkinawanOsageOttawaPaiutePakistaniPalestinianPanamanianParaguayanPennsylvania GermanPeruvianPimaPolishPortuguesePotawatomiPuebloPuerto RicanPuget Sound SalishRomanianRussianSalvadoranSamoanScandinavianScotch-IrishScottishSeminoleSenegaleseSerbianShoshoneSierra LeoneanSiouxSlavicSlovakSloveneSomaliSouth AfricanSouth AmericanSouth American IndianSoviet UnionSpaniardSpanishSpanish AmericanSpanish American IndianSri LankanSubsaharan AfricanSudaneseSwedishSwissSyrianTaiwaneseThaiTlingit-HaidaTohono O'OdhamTonganTrinidadian and TobagonianTsimshianTurkishU.S. Virgin IslanderUgandanUkrainianUruguayanUteVenezuelanVietnameseWelshWest IndianYakamaYaquiYugoslavianYumanYup'ikZimbabwean
Immigration
NonimmigrantsImmigrantsAfghanistanAfricaAlbaniaArgentinaArmeniaAsiaAustraliaAustriaBahamasBangladeshBarbadosBelarusBelgiumBelizeBoliviaBosnia and HerzegovinaBrazilBulgariaBurma/MyanmarCabo VerdeCambodiaCameroonCanadaCaribbeanCentral AmericaChileChinaColombiaCongoCosta RicaCroatiaCubaCzechoslovakiaDenmarkDominicaDominican RepublicEastern AfricaEastern AsiaEastern EuropeEcuadorEgyptEl SalvadorEnglandEritreaEthiopiaEuropeFijiFranceGermanyGhanaGreeceGrenadaGuatemalaGuyanaHaitiHondurasHong KongHungaryIndiaIndonesiaIranIraqIrelandIsraelItalyJamaicaJapanJordanKazakhstanKenyaKoreaKuwaitLaosLatin AmericaLatviaLebanonLiberiaLithuaniaMalaysiaMexicoMicronesiaMiddle AfricaMoldovaMoroccoNepalNetherlandsNicaraguaNigeriaNorth AmericaNorth MacedoniaNorthern AfricaNorthern EuropeNorwayOceaniaPakistanPanamaPeruPhilippinesPolandPortugalRomaniaRussiaSaudi ArabiaScotlandSenegalSerbiaSierra LeoneSingaporeSomaliaSouth AfricaSouth AmericaSouth Central AsiaSouth Eastern AsiaSouthern EuropeSpainSri LankaSt. Vincent and the GrenadinesSudanSwedenSwitzerlandSyriaTaiwanThailandTrinidad and TobagoTurkeyUgandaUkraineUruguayUzbekistanVenezuelaVietnamWest IndiesWestern AfricaWestern AsiaWestern EuropeYemenZaireZimbabweAzores
Carpatho Rusyn
Race
Ancestry
AfghanAfricanAlaska NativeAlaskan AthabascanAlbanianAleutAlsatianAmericanArabArapahoArgentineanArmenianAssyrian/Chaldean/SyriacAustralianAustrianBahamianBangladeshiBarbadianBasqueBelgianBelizeanBermudanBhutaneseBlackfeetBolivianBrazilianBritishBritish West IndianBulgarianBurmeseCajunCambodianCanadianCape VerdeanCarpatho RusynCelticCentral AmericanCentral American IndianCherokeeCheyenneChickasawChileanChineseChippewaChoctawColombianColvilleComancheCosta RicanCreeCreekCroatianCrowCubanCypriotCzechCzechoslovakianDanishDelawareDominicanDutchDutch West IndianEastern EuropeanEcuadorianEgyptianEnglishEstonianEthiopianEuropeanFijianFilipinoFinnishFrenchFrench American IndianFrench CanadianGermanGerman RussianGhanaianGreekGuamanian/ChamorroGuatemalanGuyaneseHaitianHmongHonduranHopiHoumaHungarianIcelanderIndian (Asian)IndonesianInupiatIranianIraqiIrishIroquoisIsraeliItalianJamaicanJapaneseJordanianKenyanKiowaKoreanLaotianLatvianLebaneseLiberianLithuanianLumbeeLuxembourgerMacedonianMalaysianMalteseMarshalleseMenomineeMexicanMexican American IndianMongolianMoroccanNative HawaiianNavajoNepaleseNew ZealanderNicaraguanNigerianNorthern EuropeanNorwegianOkinawanOsageOttawaPaiutePakistaniPalestinianPanamanianParaguayanPennsylvania GermanPeruvianPimaPolishPortuguesePotawatomiPuebloPuerto RicanPuget Sound SalishRomanianRussianSalvadoranSamoanScandinavianScotch-IrishScottishSeminoleSenegaleseSerbianShoshoneSierra LeoneanSiouxSlavicSlovakSloveneSomaliSouth AfricanSouth AmericanSouth American IndianSoviet UnionSpaniardSpanishSpanish AmericanSpanish American IndianSri LankanSubsaharan AfricanSudaneseSwedishSwissSyrianTaiwaneseThaiTlingit-HaidaTohono O'OdhamTonganTrinidadian and TobagonianTsimshianTurkishU.S. Virgin IslanderUgandanUkrainianUruguayanUteVenezuelanVietnameseWelshWest IndianYakamaYaquiYugoslavianYumanYup'ikZimbabwean
Immigration
NonimmigrantsImmigrantsAfghanistanAfricaAlbaniaArgentinaArmeniaAsiaAustraliaAustriaBahamasBangladeshBarbadosBelarusBelgiumBelizeBoliviaBosnia and HerzegovinaBrazilBulgariaBurma/MyanmarCabo VerdeCambodiaCameroonCanadaCaribbeanCentral AmericaChileChinaColombiaCongoCosta RicaCroatiaCubaCzechoslovakiaDenmarkDominicaDominican RepublicEastern AfricaEastern AsiaEastern EuropeEcuadorEgyptEl SalvadorEnglandEritreaEthiopiaEuropeFijiFranceGermanyGhanaGreeceGrenadaGuatemalaGuyanaHaitiHondurasHong KongHungaryIndiaIndonesiaIranIraqIrelandIsraelItalyJamaicaJapanJordanKazakhstanKenyaKoreaKuwaitLaosLatin AmericaLatviaLebanonLiberiaLithuaniaMalaysiaMexicoMicronesiaMiddle AfricaMoldovaMoroccoNepalNetherlandsNicaraguaNigeriaNorth AmericaNorth MacedoniaNorthern AfricaNorthern EuropeNorwayOceaniaPakistanPanamaPeruPhilippinesPolandPortugalRomaniaRussiaSaudi ArabiaScotlandSenegalSerbiaSierra LeoneSingaporeSomaliaSouth AfricaSouth AmericaSouth Central AsiaSouth Eastern AsiaSouthern EuropeSpainSri LankaSt. Vincent and the GrenadinesSudanSwedenSwitzerlandSyriaTaiwanThailandTrinidad and TobagoTurkeyUgandaUkraineUruguayUzbekistanVenezuelaVietnamWest IndiesWestern AfricaWestern AsiaWestern EuropeYemenZaireZimbabweAzores
Unemployment Among Ages 30 to 34 years
Income
Poverty
Unemployment
Labor Participation
Family Structure
Vehicle Availability
Education Level
Disability

Unemployment Among Ages 30 to 34 years Comparison

Apache

Carpatho Rusyns

Tragic
Good
7.3%
UNEMPLOYMENT AMONG AGES 30 TO 34 YEARS
0.0/ 100
METRIC RATING
325th/ 347
METRIC RANK
5.3%
UNEMPLOYMENT AMONG AGES 30 TO 34 YEARS
77.3/ 100
METRIC RATING
132nd/ 347
METRIC RANK

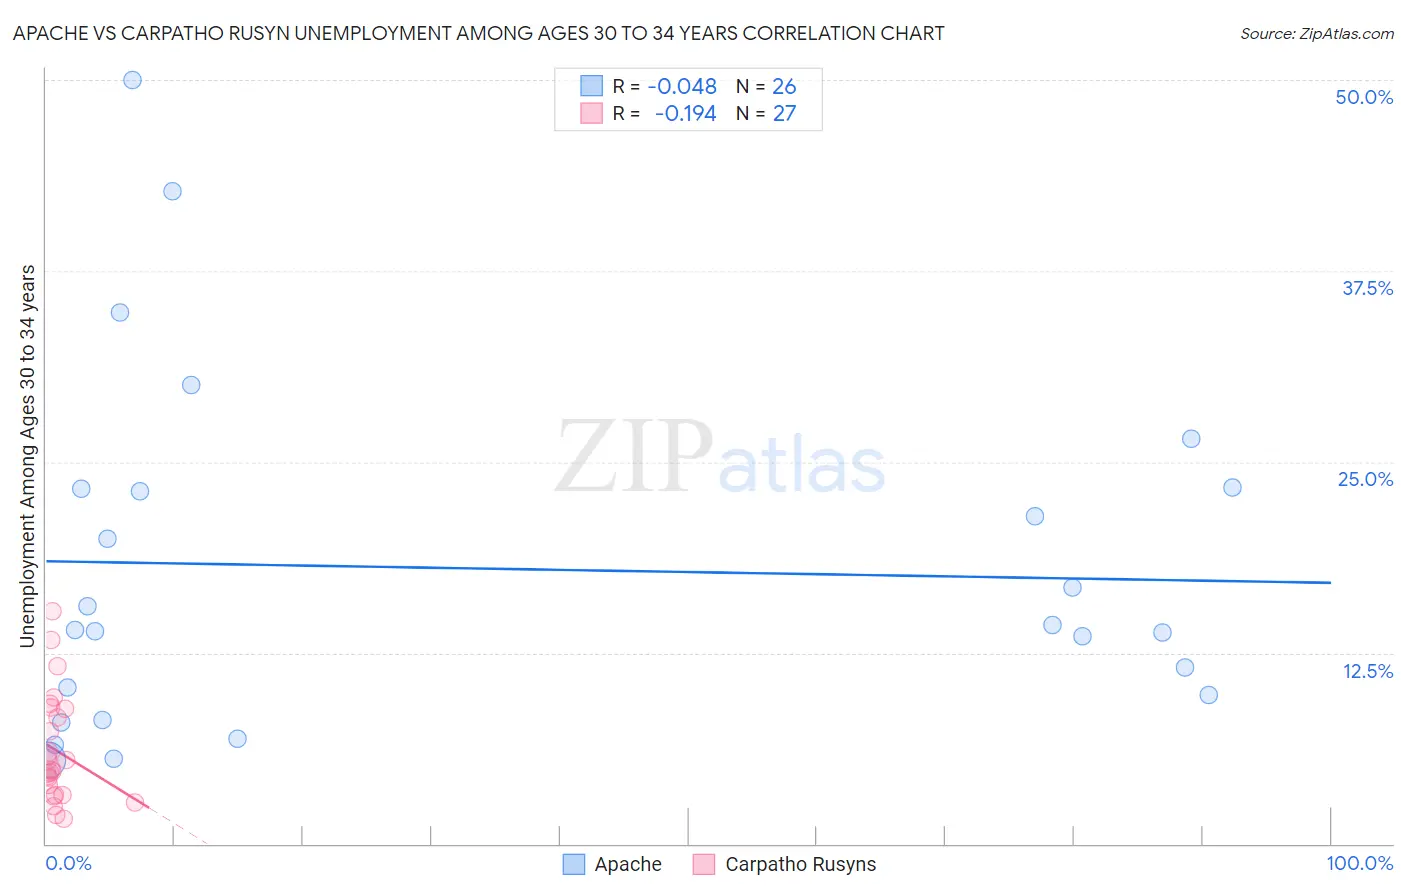
Apache vs Carpatho Rusyn Unemployment Among Ages 30 to 34 years Correlation Chart

The statistical analysis conducted on geographies consisting of 223,147,078 people shows no correlation between the proportion of Apache and unemployment rate among population between the ages 30 and 34 in the United States with a correlation coefficient (R) of -0.048 and weighted average of 7.3%. Similarly, the statistical analysis conducted on geographies consisting of 57,625,902 people shows a poor negative correlation between the proportion of Carpatho Rusyns and unemployment rate among population between the ages 30 and 34 in the United States with a correlation coefficient (R) of -0.194 and weighted average of 5.3%, a difference of 37.3%.
Apache vs Carpatho Rusyn Unemployment Among Ages 30 to 34 years

Unemployment Among Ages 30 to 34 years Correlation Summary

MeasurementApacheCarpatho Rusyn
Minimum5.5%1.6%
Maximum50.0%15.2%
Range44.5%13.6%
Mean18.0%6.1%
Median14.1%4.8%
Interquartile 25% (IQ1)9.7%3.2%
Interquartile 75% (IQ3)23.3%8.8%
Interquartile Range (IQR)13.6%5.6%
Standard Deviation (Sample)11.4%3.5%
Standard Deviation (Population)11.2%3.4%

Similar Demographics by Unemployment Among Ages 30 to 34 years

Demographics Similar to Apache by Unemployment Among Ages 30 to 34 years

In terms of unemployment among ages 30 to 34 years, the demographic groups most similar to Apache are Immigrants from Dominica (7.3%, a difference of 0.28%), Immigrants from Yemen (7.3%, a difference of 0.86%), Marshallese (7.2%, a difference of 1.3%), Immigrants from Guyana (7.2%, a difference of 1.8%), and Cape Verdean (7.2%, a difference of 2.1%).
DemographicsRating | RankUnemployment Among Ages 30 to 34 years
Blacks/African Americans
0.0
/100
|
#318
Tragic
7.2%
Guyanese
0.0
/100
|
#319
Tragic
7.2%
Cape Verdeans
0.0
/100
|
#320
Tragic
7.2%
Immigrants | Guyana
0.0
/100
|
#321
Tragic
7.2%
Marshallese
0.0
/100
|
#322
Tragic
7.2%
Immigrants | Yemen
0.0
/100
|
#323
Tragic
7.3%
Immigrants | Dominica
0.0
/100
|
#324
Tragic
7.3%
Apache
0.0
/100
|
#325
Tragic
7.3%
Dominicans
0.0
/100
|
#326
Tragic
7.7%
Immigrants | Dominican Republic
0.0
/100
|
#327
Tragic
7.7%
Chippewa
0.0
/100
|
#328
Tragic
7.8%
Cheyenne
0.0
/100
|
#329
Tragic
7.8%
Shoshone
0.0
/100
|
#330
Tragic
7.9%
Sioux
0.0
/100
|
#331
Tragic
8.0%
Natives/Alaskans
0.0
/100
|
#332
Tragic
8.2%

Demographics Similar to Carpatho Rusyns by Unemployment Among Ages 30 to 34 years

In terms of unemployment among ages 30 to 34 years, the demographic groups most similar to Carpatho Rusyns are Immigrants from Northern Europe (5.3%, a difference of 0.0%), Immigrants from Eastern Europe (5.3%, a difference of 0.010%), German (5.3%, a difference of 0.050%), Bangladeshi (5.3%, a difference of 0.070%), and Polish (5.3%, a difference of 0.15%).
DemographicsRating | RankUnemployment Among Ages 30 to 34 years
Greeks
80.4
/100
|
#125
Excellent
5.3%
Immigrants | Sri Lanka
80.2
/100
|
#126
Excellent
5.3%
Taiwanese
79.4
/100
|
#127
Good
5.3%
Immigrants | Uruguay
79.3
/100
|
#128
Good
5.3%
Poles
78.8
/100
|
#129
Good
5.3%
Germans
77.8
/100
|
#130
Good
5.3%
Immigrants | Eastern Europe
77.4
/100
|
#131
Good
5.3%
Carpatho Rusyns
77.3
/100
|
#132
Good
5.3%
Immigrants | Northern Europe
77.3
/100
|
#133
Good
5.3%
Bangladeshis
76.6
/100
|
#134
Good
5.3%
Palestinians
75.1
/100
|
#135
Good
5.4%
Pakistanis
74.6
/100
|
#136
Good
5.4%
Immigrants | Canada
74.6
/100
|
#137
Good
5.4%
Serbians
72.9
/100
|
#138
Good
5.4%
Lithuanians
72.4
/100
|
#139
Good
5.4%