American vs Sioux Unemployment Among Ages 25 to 29 years
COMPARE
American
Sioux
Unemployment Among Ages 25 to 29 years
Unemployment Among Ages 25 to 29 years Comparison
Americans
Sioux
7.4%
UNEMPLOYMENT AMONG AGES 25 TO 29 YEARS
0.1/ 100
METRIC RATING
260th/ 347
METRIC RANK
11.7%
UNEMPLOYMENT AMONG AGES 25 TO 29 YEARS
0.0/ 100
METRIC RATING
338th/ 347
METRIC RANK
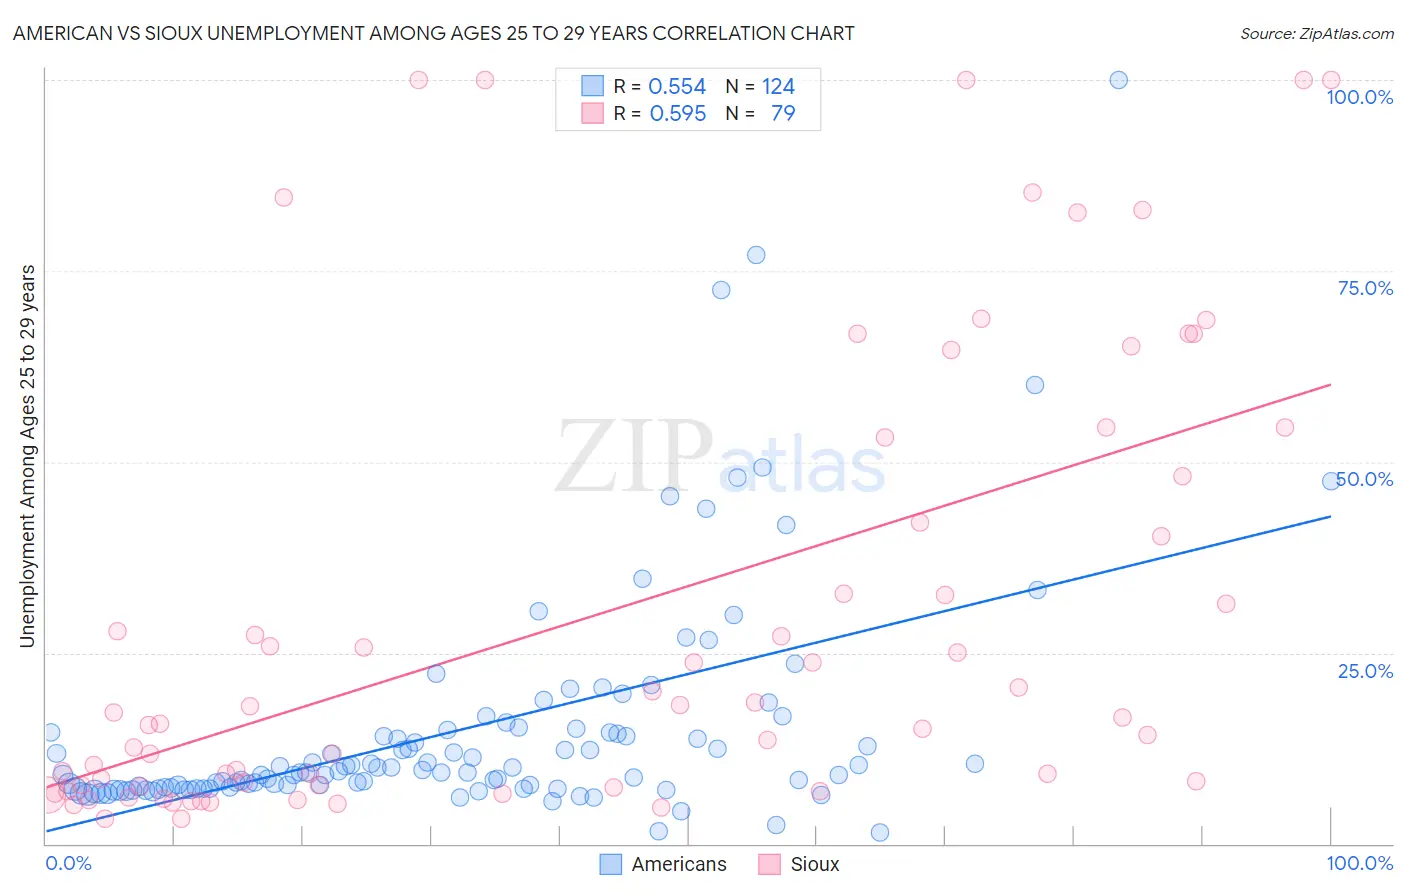
American vs Sioux Unemployment Among Ages 25 to 29 years Correlation Chart
The statistical analysis conducted on geographies consisting of 512,790,797 people shows a substantial positive correlation between the proportion of Americans and unemployment rate among population between the ages 25 and 29 in the United States with a correlation coefficient (R) of 0.554 and weighted average of 7.4%. Similarly, the statistical analysis conducted on geographies consisting of 224,112,543 people shows a substantial positive correlation between the proportion of Sioux and unemployment rate among population between the ages 25 and 29 in the United States with a correlation coefficient (R) of 0.595 and weighted average of 11.7%, a difference of 58.3%.
Unemployment Among Ages 25 to 29 years Correlation Summary
| Measurement | American | Sioux |
| Minimum | 1.5% | 3.3% |
| Maximum | 100.0% | 100.0% |
| Range | 98.5% | 96.7% |
| Mean | 14.9% | 29.7% |
| Median | 9.4% | 16.6% |
| Interquartile 25% (IQ1) | 7.3% | 7.5% |
| Interquartile 75% (IQ3) | 14.6% | 48.1% |
| Interquartile Range (IQR) | 7.3% | 40.6% |
| Standard Deviation (Sample) | 15.1% | 29.5% |
| Standard Deviation (Population) | 15.1% | 29.3% |
Similar Demographics by Unemployment Among Ages 25 to 29 years
Demographics Similar to Americans by Unemployment Among Ages 25 to 29 years
In terms of unemployment among ages 25 to 29 years, the demographic groups most similar to Americans are Nigerian (7.4%, a difference of 0.080%), Ecuadorian (7.4%, a difference of 0.14%), Kiowa (7.4%, a difference of 0.22%), Immigrants from Western Africa (7.4%, a difference of 0.31%), and Immigrants from Fiji (7.4%, a difference of 0.37%).
| Demographics | Rating | Rank | Unemployment Among Ages 25 to 29 years |
| Immigrants | Portugal | 0.3 /100 | #253 | Tragic 7.2% |
| Ghanaians | 0.3 /100 | #254 | Tragic 7.2% |
| Immigrants | Cameroon | 0.3 /100 | #255 | Tragic 7.2% |
| Mexican American Indians | 0.3 /100 | #256 | Tragic 7.3% |
| Assyrians/Chaldeans/Syriacs | 0.2 /100 | #257 | Tragic 7.3% |
| Ottawa | 0.1 /100 | #258 | Tragic 7.3% |
| Cree | 0.1 /100 | #259 | Tragic 7.3% |
| Americans | 0.1 /100 | #260 | Tragic 7.4% |
| Nigerians | 0.1 /100 | #261 | Tragic 7.4% |
| Ecuadorians | 0.1 /100 | #262 | Tragic 7.4% |
| Kiowa | 0.1 /100 | #263 | Tragic 7.4% |
| Immigrants | Western Africa | 0.1 /100 | #264 | Tragic 7.4% |
| Immigrants | Fiji | 0.1 /100 | #265 | Tragic 7.4% |
| Paiute | 0.1 /100 | #266 | Tragic 7.4% |
| Pennsylvania Germans | 0.1 /100 | #267 | Tragic 7.4% |
Demographics Similar to Sioux by Unemployment Among Ages 25 to 29 years
In terms of unemployment among ages 25 to 29 years, the demographic groups most similar to Sioux are Pima (11.8%, a difference of 0.94%), Cheyenne (11.8%, a difference of 1.4%), Tohono O'odham (12.1%, a difference of 3.5%), Menominee (11.3%, a difference of 3.5%), and Lumbee (11.2%, a difference of 3.8%).
| Demographics | Rating | Rank | Unemployment Among Ages 25 to 29 years |
| Alaska Natives | 0.0 /100 | #331 | Tragic 10.2% |
| Pueblo | 0.0 /100 | #332 | Tragic 10.4% |
| Alaskan Athabascans | 0.0 /100 | #333 | Tragic 10.8% |
| Yuman | 0.0 /100 | #334 | Tragic 11.0% |
| Puerto Ricans | 0.0 /100 | #335 | Tragic 11.1% |
| Lumbee | 0.0 /100 | #336 | Tragic 11.2% |
| Menominee | 0.0 /100 | #337 | Tragic 11.3% |
| Sioux | 0.0 /100 | #338 | Tragic 11.7% |
| Pima | 0.0 /100 | #339 | Tragic 11.8% |
| Cheyenne | 0.0 /100 | #340 | Tragic 11.8% |
| Tohono O'odham | 0.0 /100 | #341 | Tragic 12.1% |
| Navajo | 0.0 /100 | #342 | Tragic 12.2% |
| Inupiat | 0.0 /100 | #343 | Tragic 13.4% |
| Hopi | 0.0 /100 | #344 | Tragic 13.5% |
| Arapaho | 0.0 /100 | #345 | Tragic 15.4% |