American vs Immigrants from Sweden Unemployment Among Ages 60 to 64 years

COMPARE

American
Race
Ancestry
AfghanAfricanAlaska NativeAlaskan AthabascanAlbanianAleutAlsatianAmericanApacheArabArapahoArgentineanArmenianAssyrian/Chaldean/SyriacAustralianAustrianBahamianBangladeshiBarbadianBasqueBelgianBelizeanBermudanBhutaneseBlackfeetBolivianBrazilianBritishBritish West IndianBulgarianBurmeseCajunCambodianCanadianCape VerdeanCarpatho RusynCelticCentral AmericanCentral American IndianCherokeeCheyenneChickasawChileanChineseChippewaChoctawColombianColvilleComancheCosta RicanCreeCreekCroatianCrowCubanCypriotCzechCzechoslovakianDanishDelawareDominicanDutchDutch West IndianEastern EuropeanEcuadorianEgyptianEnglishEstonianEthiopianEuropeanFijianFilipinoFinnishFrenchFrench American IndianFrench CanadianGermanGerman RussianGhanaianGreekGuamanian/ChamorroGuatemalanGuyaneseHaitianHmongHonduranHopiHoumaHungarianIcelanderIndian (Asian)IndonesianInupiatIranianIraqiIrishIroquoisIsraeliItalianJamaicanJapaneseJordanianKenyanKiowaKoreanLaotianLatvianLebaneseLiberianLithuanianLumbeeLuxembourgerMacedonianMalaysianMalteseMarshalleseMenomineeMexicanMexican American IndianMongolianMoroccanNative HawaiianNavajoNepaleseNew ZealanderNicaraguanNigerianNorthern EuropeanNorwegianOkinawanOsageOttawaPaiutePakistaniPalestinianPanamanianParaguayanPennsylvania GermanPeruvianPimaPolishPortuguesePotawatomiPuebloPuerto RicanPuget Sound SalishRomanianRussianSalvadoranSamoanScandinavianScotch-IrishScottishSeminoleSenegaleseSerbianShoshoneSierra LeoneanSiouxSlavicSlovakSloveneSomaliSouth AfricanSouth AmericanSouth American IndianSoviet UnionSpaniardSpanishSpanish AmericanSpanish American IndianSri LankanSubsaharan AfricanSudaneseSwedishSwissSyrianTaiwaneseThaiTlingit-HaidaTohono O'OdhamTonganTrinidadian and TobagonianTsimshianTurkishU.S. Virgin IslanderUgandanUkrainianUruguayanUteVenezuelanVietnameseWelshWest IndianYakamaYaquiYugoslavianYumanYup'ikZimbabwean
Immigration
NonimmigrantsImmigrantsAfghanistanAfricaAlbaniaArgentinaArmeniaAsiaAustraliaAustriaBahamasBangladeshBarbadosBelarusBelgiumBelizeBoliviaBosnia and HerzegovinaBrazilBulgariaBurma/MyanmarCabo VerdeCambodiaCameroonCanadaCaribbeanCentral AmericaChileChinaColombiaCongoCosta RicaCroatiaCubaCzechoslovakiaDenmarkDominicaDominican RepublicEastern AfricaEastern AsiaEastern EuropeEcuadorEgyptEl SalvadorEnglandEritreaEthiopiaEuropeFijiFranceGermanyGhanaGreeceGrenadaGuatemalaGuyanaHaitiHondurasHong KongHungaryIndiaIndonesiaIranIraqIrelandIsraelItalyJamaicaJapanJordanKazakhstanKenyaKoreaKuwaitLaosLatin AmericaLatviaLebanonLiberiaLithuaniaMalaysiaMexicoMicronesiaMiddle AfricaMoldovaMoroccoNepalNetherlandsNicaraguaNigeriaNorth AmericaNorth MacedoniaNorthern AfricaNorthern EuropeNorwayOceaniaPakistanPanamaPeruPhilippinesPolandPortugalRomaniaRussiaSaudi ArabiaScotlandSenegalSerbiaSierra LeoneSingaporeSomaliaSouth AfricaSouth AmericaSouth Central AsiaSouth Eastern AsiaSouthern EuropeSpainSri LankaSt. Vincent and the GrenadinesSudanSwitzerlandSyriaTaiwanThailandTrinidad and TobagoTurkeyUgandaUkraineUruguayUzbekistanVenezuelaVietnamWest IndiesWestern AfricaWestern AsiaWestern EuropeYemenZaireZimbabweAzores
Immigrants from Sweden
Race
Ancestry
AfghanAfricanAlaska NativeAlaskan AthabascanAlbanianAleutAlsatianApacheArabArapahoArgentineanArmenianAssyrian/Chaldean/SyriacAustralianAustrianBahamianBangladeshiBarbadianBasqueBelgianBelizeanBermudanBhutaneseBlackfeetBolivianBrazilianBritishBritish West IndianBulgarianBurmeseCajunCambodianCanadianCape VerdeanCarpatho RusynCelticCentral AmericanCentral American IndianCherokeeCheyenneChickasawChileanChineseChippewaChoctawColombianColvilleComancheCosta RicanCreeCreekCroatianCrowCubanCypriotCzechCzechoslovakianDanishDelawareDominicanDutchDutch West IndianEastern EuropeanEcuadorianEgyptianEnglishEstonianEthiopianEuropeanFijianFilipinoFinnishFrenchFrench American IndianFrench CanadianGermanGerman RussianGhanaianGreekGuamanian/ChamorroGuatemalanGuyaneseHaitianHmongHonduranHopiHoumaHungarianIcelanderIndian (Asian)IndonesianInupiatIranianIraqiIrishIroquoisIsraeliItalianJamaicanJapaneseJordanianKenyanKiowaKoreanLaotianLatvianLebaneseLiberianLithuanianLumbeeLuxembourgerMacedonianMalaysianMalteseMarshalleseMenomineeMexicanMexican American IndianMongolianMoroccanNative HawaiianNavajoNepaleseNew ZealanderNicaraguanNigerianNorthern EuropeanNorwegianOkinawanOsageOttawaPaiutePakistaniPalestinianPanamanianParaguayanPennsylvania GermanPeruvianPimaPolishPortuguesePotawatomiPuebloPuerto RicanPuget Sound SalishRomanianRussianSalvadoranSamoanScandinavianScotch-IrishScottishSeminoleSenegaleseSerbianShoshoneSierra LeoneanSiouxSlavicSlovakSloveneSomaliSouth AfricanSouth AmericanSouth American IndianSoviet UnionSpaniardSpanishSpanish AmericanSpanish American IndianSri LankanSubsaharan AfricanSudaneseSwedishSwissSyrianTaiwaneseThaiTlingit-HaidaTohono O'OdhamTonganTrinidadian and TobagonianTsimshianTurkishU.S. Virgin IslanderUgandanUkrainianUruguayanUteVenezuelanVietnameseWelshWest IndianYakamaYaquiYugoslavianYumanYup'ikZimbabwean
Immigration
NonimmigrantsImmigrantsAfghanistanAfricaAlbaniaArgentinaArmeniaAsiaAustraliaAustriaBahamasBangladeshBarbadosBelarusBelgiumBelizeBoliviaBosnia and HerzegovinaBrazilBulgariaBurma/MyanmarCabo VerdeCambodiaCameroonCanadaCaribbeanCentral AmericaChileChinaColombiaCongoCosta RicaCroatiaCubaCzechoslovakiaDenmarkDominicaDominican RepublicEastern AfricaEastern AsiaEastern EuropeEcuadorEgyptEl SalvadorEnglandEritreaEthiopiaEuropeFijiFranceGermanyGhanaGreeceGrenadaGuatemalaGuyanaHaitiHondurasHong KongHungaryIndiaIndonesiaIranIraqIrelandIsraelItalyJamaicaJapanJordanKazakhstanKenyaKoreaKuwaitLaosLatin AmericaLatviaLebanonLiberiaLithuaniaMalaysiaMexicoMicronesiaMiddle AfricaMoldovaMoroccoNepalNetherlandsNicaraguaNigeriaNorth AmericaNorth MacedoniaNorthern AfricaNorthern EuropeNorwayOceaniaPakistanPanamaPeruPhilippinesPolandPortugalRomaniaRussiaSaudi ArabiaScotlandSenegalSerbiaSierra LeoneSingaporeSomaliaSouth AfricaSouth AmericaSouth Central AsiaSouth Eastern AsiaSouthern EuropeSpainSri LankaSt. Vincent and the GrenadinesSudanSwedenSwitzerlandSyriaTaiwanThailandTrinidad and TobagoTurkeyUgandaUkraineUruguayUzbekistanVenezuelaVietnamWest IndiesWestern AfricaWestern AsiaWestern EuropeYemenZaireZimbabweAzores
Unemployment Among Ages 60 to 64 years
Income
Poverty
Unemployment
Labor Participation
Family Structure
Vehicle Availability
Education Level
Disability

Unemployment Among Ages 60 to 64 years Comparison

Americans

Immigrants from Sweden

Good
Average
4.8%
UNEMPLOYMENT AMONG AGES 60 TO 64 YEARS
75.7/ 100
METRIC RATING
152nd/ 347
METRIC RANK
4.9%
UNEMPLOYMENT AMONG AGES 60 TO 64 YEARS
44.3/ 100
METRIC RATING
179th/ 347
METRIC RANK

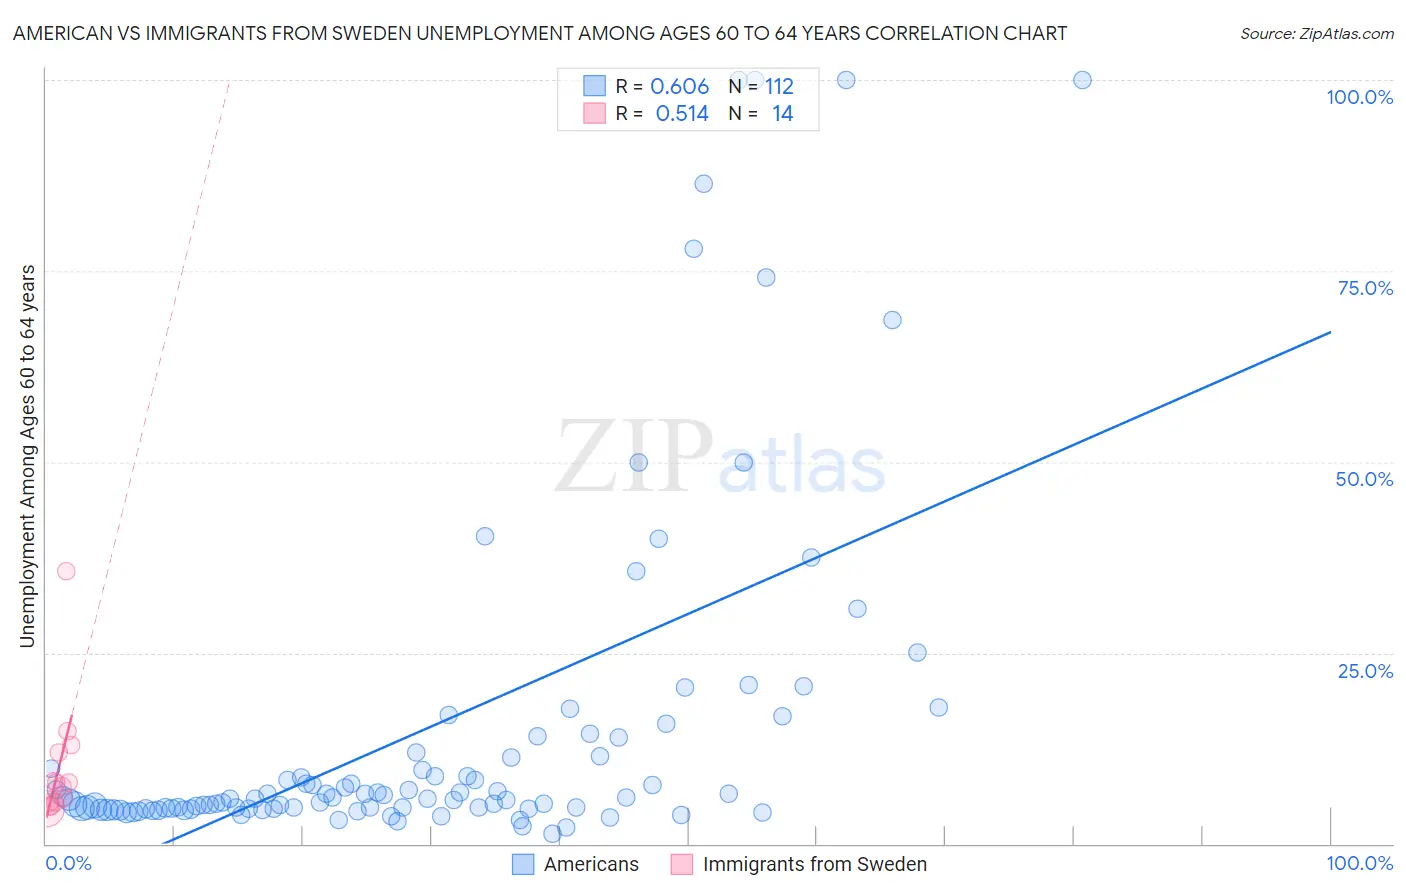
American vs Immigrants from Sweden Unemployment Among Ages 60 to 64 years Correlation Chart

The statistical analysis conducted on geographies consisting of 469,715,851 people shows a significant positive correlation between the proportion of Americans and unemployment rate among population between the ages 60 and 64 in the United States with a correlation coefficient (R) of 0.606 and weighted average of 4.8%. Similarly, the statistical analysis conducted on geographies consisting of 157,569,680 people shows a substantial positive correlation between the proportion of Immigrants from Sweden and unemployment rate among population between the ages 60 and 64 in the United States with a correlation coefficient (R) of 0.514 and weighted average of 4.9%, a difference of 1.2%.
American vs Immigrants from Sweden Unemployment Among Ages 60 to 64 years

Unemployment Among Ages 60 to 64 years Correlation Summary

MeasurementAmericanImmigrants from Sweden
Minimum1.3%4.5%
Maximum100.0%35.7%
Range98.7%31.1%
Mean15.0%9.9%
Median5.9%7.7%
Interquartile 25% (IQ1)4.6%5.4%
Interquartile 75% (IQ3)11.7%12.0%
Interquartile Range (IQR)7.1%6.6%
Standard Deviation (Sample)22.7%8.1%
Standard Deviation (Population)22.6%7.8%

Similar Demographics by Unemployment Among Ages 60 to 64 years

Demographics Similar to Americans by Unemployment Among Ages 60 to 64 years

In terms of unemployment among ages 60 to 64 years, the demographic groups most similar to Americans are Bolivian (4.8%, a difference of 0.010%), Immigrants from South Africa (4.8%, a difference of 0.14%), Chilean (4.8%, a difference of 0.14%), Immigrants from Italy (4.8%, a difference of 0.15%), and Arab (4.8%, a difference of 0.16%).
DemographicsRating | RankUnemployment Among Ages 60 to 64 years
Burmese
83.1
/100
|
#145
Excellent
4.8%
Turks
81.9
/100
|
#146
Excellent
4.8%
Mongolians
81.2
/100
|
#147
Excellent
4.8%
Latvians
79.1
/100
|
#148
Good
4.8%
Arabs
78.8
/100
|
#149
Good
4.8%
Immigrants | Italy
78.7
/100
|
#150
Good
4.8%
Immigrants | South Africa
78.5
/100
|
#151
Good
4.8%
Americans
75.7
/100
|
#152
Good
4.8%
Bolivians
75.5
/100
|
#153
Good
4.8%
Chileans
72.6
/100
|
#154
Good
4.8%
Filipinos
72.1
/100
|
#155
Good
4.8%
Immigrants | Bolivia
69.2
/100
|
#156
Good
4.8%
Laotians
66.8
/100
|
#157
Good
4.8%
Immigrants | Taiwan
66.0
/100
|
#158
Good
4.8%
Spanish
65.5
/100
|
#159
Good
4.8%

Demographics Similar to Immigrants from Sweden by Unemployment Among Ages 60 to 64 years

In terms of unemployment among ages 60 to 64 years, the demographic groups most similar to Immigrants from Sweden are Immigrants from Malaysia (4.9%, a difference of 0.010%), Nonimmigrants (4.9%, a difference of 0.010%), Bermudan (4.9%, a difference of 0.080%), Immigrants from Latvia (4.9%, a difference of 0.090%), and Asian (4.9%, a difference of 0.13%).
DemographicsRating | RankUnemployment Among Ages 60 to 64 years
Immigrants | Turkey
52.8
/100
|
#172
Average
4.9%
Immigrants | Hungary
50.2
/100
|
#173
Average
4.9%
Immigrants | Western Europe
50.0
/100
|
#174
Average
4.9%
Immigrants | Latvia
46.9
/100
|
#175
Average
4.9%
Bermudans
46.5
/100
|
#176
Average
4.9%
Immigrants | Malaysia
44.7
/100
|
#177
Average
4.9%
Immigrants | Nonimmigrants
44.5
/100
|
#178
Average
4.9%
Immigrants | Sweden
44.3
/100
|
#179
Average
4.9%
Asians
40.8
/100
|
#180
Average
4.9%
Hungarians
40.6
/100
|
#181
Average
4.9%
Sri Lankans
39.8
/100
|
#182
Fair
4.9%
Sub-Saharan Africans
38.9
/100
|
#183
Fair
4.9%
Immigrants | Ukraine
37.6
/100
|
#184
Fair
4.9%
Ute
37.4
/100
|
#185
Fair
4.9%
Spaniards
35.8
/100
|
#186
Fair
4.9%