American vs Immigrants from Nicaragua Unemployment Among Youth under 25 years
COMPARE
American
Immigrants from Nicaragua
Unemployment Among Youth under 25 years
Unemployment Among Youth under 25 years Comparison
Americans
Immigrants from Nicaragua
11.7%
UNEMPLOYMENT AMONG YOUTH UNDER 25 YEARS
34.5/ 100
METRIC RATING
183rd/ 347
METRIC RANK
11.2%
UNEMPLOYMENT AMONG YOUTH UNDER 25 YEARS
96.7/ 100
METRIC RATING
78th/ 347
METRIC RANK
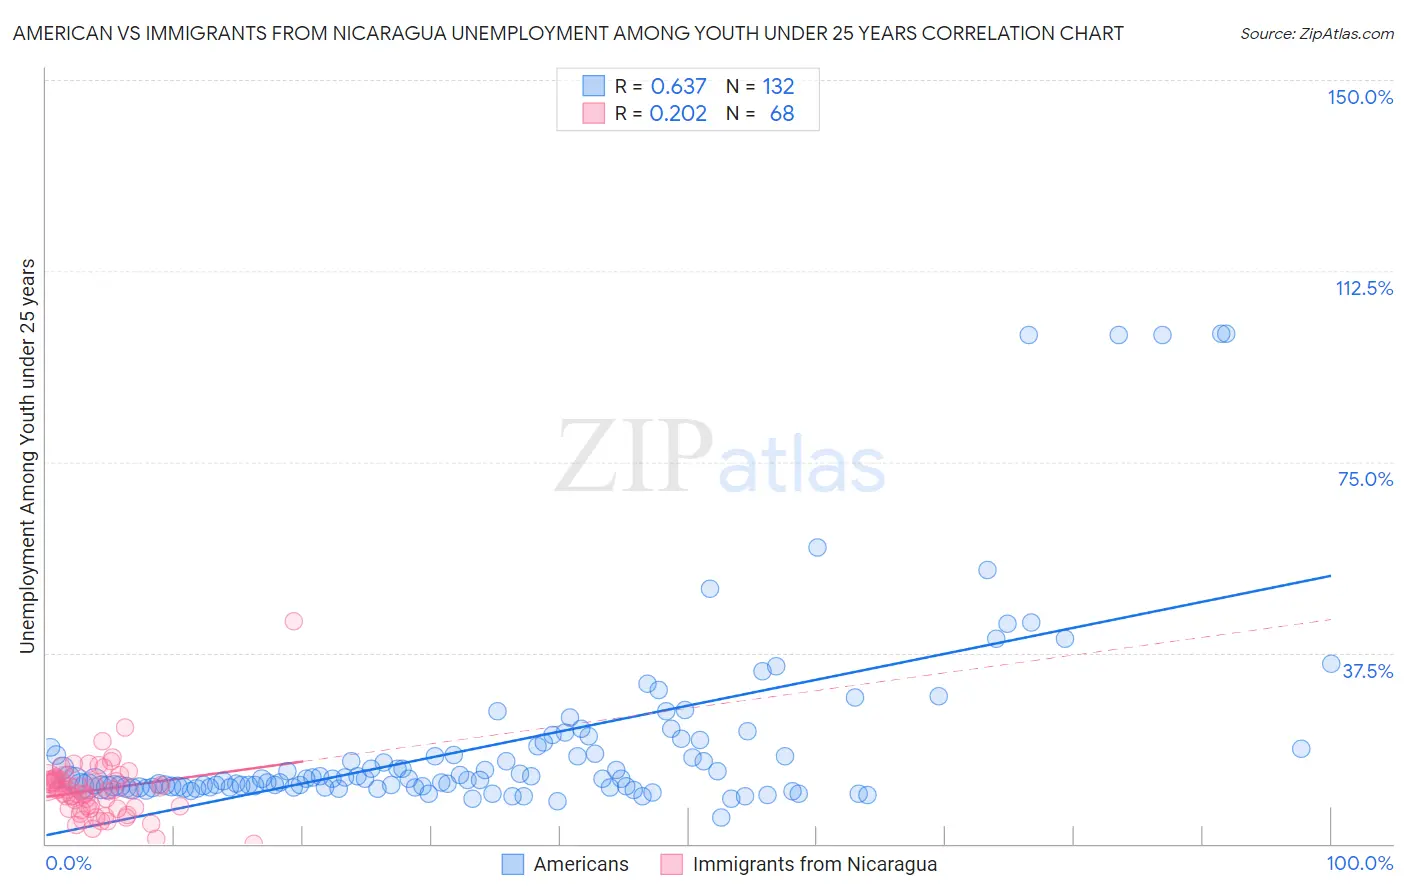
American vs Immigrants from Nicaragua Unemployment Among Youth under 25 years Correlation Chart
The statistical analysis conducted on geographies consisting of 554,335,703 people shows a significant positive correlation between the proportion of Americans and unemployment rate among youth under the age of 25 in the United States with a correlation coefficient (R) of 0.637 and weighted average of 11.7%. Similarly, the statistical analysis conducted on geographies consisting of 235,323,133 people shows a weak positive correlation between the proportion of Immigrants from Nicaragua and unemployment rate among youth under the age of 25 in the United States with a correlation coefficient (R) of 0.202 and weighted average of 11.2%, a difference of 4.3%.
Unemployment Among Youth under 25 years Correlation Summary
| Measurement | American | Immigrants from Nicaragua |
| Minimum | 5.1% | 0.10% |
| Maximum | 100.1% | 43.7% |
| Range | 95.0% | 43.6% |
| Mean | 19.6% | 10.6% |
| Median | 12.8% | 10.5% |
| Interquartile 25% (IQ1) | 11.1% | 7.0% |
| Interquartile 75% (IQ3) | 19.1% | 12.4% |
| Interquartile Range (IQR) | 8.0% | 5.3% |
| Standard Deviation (Sample) | 18.5% | 5.9% |
| Standard Deviation (Population) | 18.5% | 5.8% |
Similar Demographics by Unemployment Among Youth under 25 years
Demographics Similar to Americans by Unemployment Among Youth under 25 years
In terms of unemployment among youth under 25 years, the demographic groups most similar to Americans are Immigrants from Eastern Europe (11.7%, a difference of 0.010%), French American Indian (11.7%, a difference of 0.020%), Maltese (11.7%, a difference of 0.030%), Immigrants from Italy (11.7%, a difference of 0.080%), and Immigrants from Egypt (11.7%, a difference of 0.12%).
| Demographics | Rating | Rank | Unemployment Among Youth under 25 years |
| Ugandans | 45.6 /100 | #176 | Average 11.6% |
| Immigrants | Denmark | 45.0 /100 | #177 | Average 11.6% |
| Immigrants | Europe | 42.4 /100 | #178 | Average 11.6% |
| Immigrants | Hong Kong | 42.4 /100 | #179 | Average 11.6% |
| Spaniards | 39.8 /100 | #180 | Fair 11.7% |
| Syrians | 38.4 /100 | #181 | Fair 11.7% |
| Immigrants | Italy | 36.2 /100 | #182 | Fair 11.7% |
| Americans | 34.5 /100 | #183 | Fair 11.7% |
| Immigrants | Eastern Europe | 34.1 /100 | #184 | Fair 11.7% |
| French American Indians | 34.0 /100 | #185 | Fair 11.7% |
| Maltese | 33.9 /100 | #186 | Fair 11.7% |
| Immigrants | Egypt | 31.9 /100 | #187 | Fair 11.7% |
| Immigrants | Poland | 31.4 /100 | #188 | Fair 11.7% |
| Japanese | 30.8 /100 | #189 | Fair 11.7% |
| Portuguese | 30.3 /100 | #190 | Fair 11.7% |
Demographics Similar to Immigrants from Nicaragua by Unemployment Among Youth under 25 years
In terms of unemployment among youth under 25 years, the demographic groups most similar to Immigrants from Nicaragua are Immigrants from Canada (11.2%, a difference of 0.010%), White/Caucasian (11.2%, a difference of 0.060%), Immigrants from Bulgaria (11.2%, a difference of 0.090%), German Russian (11.2%, a difference of 0.11%), and French (11.2%, a difference of 0.13%).
| Demographics | Rating | Rank | Unemployment Among Youth under 25 years |
| Bhutanese | 97.4 /100 | #71 | Exceptional 11.2% |
| Immigrants | Australia | 97.3 /100 | #72 | Exceptional 11.2% |
| Creek | 97.2 /100 | #73 | Exceptional 11.2% |
| New Zealanders | 97.2 /100 | #74 | Exceptional 11.2% |
| French | 97.1 /100 | #75 | Exceptional 11.2% |
| German Russians | 97.0 /100 | #76 | Exceptional 11.2% |
| Whites/Caucasians | 96.9 /100 | #77 | Exceptional 11.2% |
| Immigrants | Nicaragua | 96.7 /100 | #78 | Exceptional 11.2% |
| Immigrants | Canada | 96.7 /100 | #79 | Exceptional 11.2% |
| Immigrants | Bulgaria | 96.4 /100 | #80 | Exceptional 11.2% |
| Icelanders | 96.3 /100 | #81 | Exceptional 11.2% |
| Northern Europeans | 96.2 /100 | #82 | Exceptional 11.2% |
| Bolivians | 96.1 /100 | #83 | Exceptional 11.2% |
| French Canadians | 95.9 /100 | #84 | Exceptional 11.2% |
| Immigrants | South Central Asia | 95.9 /100 | #85 | Exceptional 11.2% |