Alsatian vs Venezuelan Unemployment Among Ages 45 to 54 years
COMPARE
Alsatian
Venezuelan
Unemployment Among Ages 45 to 54 years
Unemployment Among Ages 45 to 54 years Comparison
Alsatians
Venezuelans
4.7%
UNEMPLOYMENT AMONG AGES 45 TO 54 YEARS
1.6/ 100
METRIC RATING
237th/ 347
METRIC RANK
4.0%
UNEMPLOYMENT AMONG AGES 45 TO 54 YEARS
100.0/ 100
METRIC RATING
10th/ 347
METRIC RANK
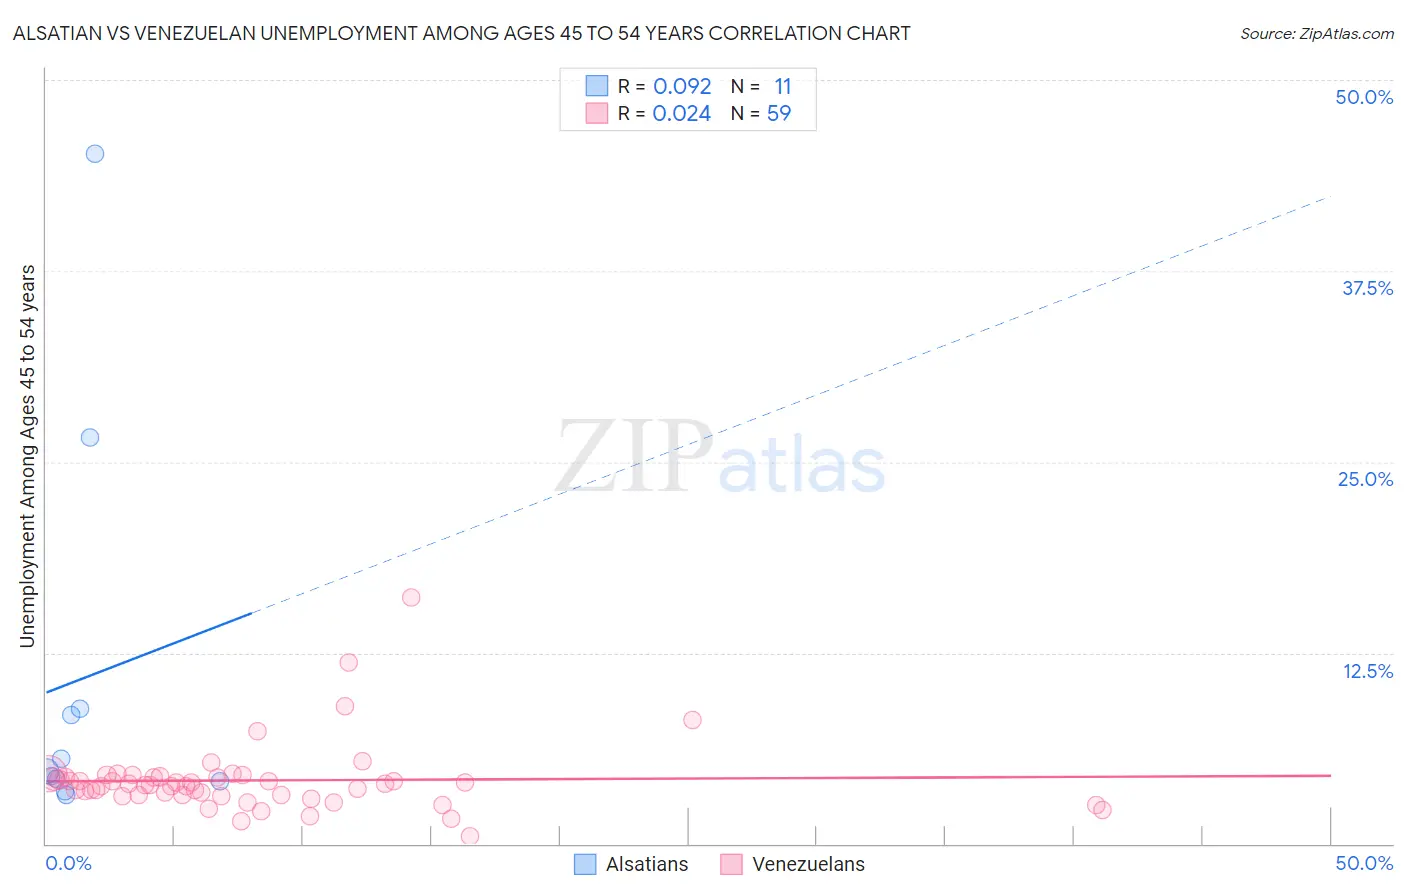
Alsatian vs Venezuelan Unemployment Among Ages 45 to 54 years Correlation Chart
The statistical analysis conducted on geographies consisting of 81,984,920 people shows a slight positive correlation between the proportion of Alsatians and unemployment rate among population between the ages 45 and 54 in the United States with a correlation coefficient (R) of 0.092 and weighted average of 4.7%. Similarly, the statistical analysis conducted on geographies consisting of 301,674,549 people shows no correlation between the proportion of Venezuelans and unemployment rate among population between the ages 45 and 54 in the United States with a correlation coefficient (R) of 0.024 and weighted average of 4.0%, a difference of 18.7%.
Unemployment Among Ages 45 to 54 years Correlation Summary
| Measurement | Alsatian | Venezuelan |
| Minimum | 3.2% | 0.50% |
| Maximum | 45.2% | 16.1% |
| Range | 42.0% | 15.6% |
| Mean | 10.8% | 4.1% |
| Median | 4.8% | 3.9% |
| Interquartile 25% (IQ1) | 4.1% | 3.2% |
| Interquartile 75% (IQ3) | 8.8% | 4.4% |
| Interquartile Range (IQR) | 4.7% | 1.2% |
| Standard Deviation (Sample) | 13.2% | 2.4% |
| Standard Deviation (Population) | 12.6% | 2.3% |
Similar Demographics by Unemployment Among Ages 45 to 54 years
Demographics Similar to Alsatians by Unemployment Among Ages 45 to 54 years
In terms of unemployment among ages 45 to 54 years, the demographic groups most similar to Alsatians are Yaqui (4.7%, a difference of 0.17%), Spanish American (4.7%, a difference of 0.17%), Immigrants from Iraq (4.7%, a difference of 0.20%), Delaware (4.8%, a difference of 0.27%), and Central American (4.8%, a difference of 0.27%).
| Demographics | Rating | Rank | Unemployment Among Ages 45 to 54 years |
| Japanese | 2.8 /100 | #230 | Tragic 4.7% |
| Immigrants | Ireland | 2.7 /100 | #231 | Tragic 4.7% |
| Ottawa | 2.7 /100 | #232 | Tragic 4.7% |
| Immigrants | Immigrants | 2.6 /100 | #233 | Tragic 4.7% |
| Soviet Union | 2.6 /100 | #234 | Tragic 4.7% |
| Cree | 2.3 /100 | #235 | Tragic 4.7% |
| Tlingit-Haida | 2.3 /100 | #236 | Tragic 4.7% |
| Alsatians | 1.6 /100 | #237 | Tragic 4.7% |
| Yaqui | 1.4 /100 | #238 | Tragic 4.7% |
| Spanish Americans | 1.4 /100 | #239 | Tragic 4.7% |
| Immigrants | Iraq | 1.3 /100 | #240 | Tragic 4.7% |
| Delaware | 1.3 /100 | #241 | Tragic 4.8% |
| Central Americans | 1.3 /100 | #242 | Tragic 4.8% |
| Portuguese | 1.1 /100 | #243 | Tragic 4.8% |
| Seminole | 1.1 /100 | #244 | Tragic 4.8% |
Demographics Similar to Venezuelans by Unemployment Among Ages 45 to 54 years
In terms of unemployment among ages 45 to 54 years, the demographic groups most similar to Venezuelans are Scandinavian (4.0%, a difference of 0.14%), Swedish (4.0%, a difference of 0.15%), Cuban (4.0%, a difference of 0.30%), Immigrants from Bosnia and Herzegovina (4.0%, a difference of 0.35%), and Czech (4.0%, a difference of 0.62%).
| Demographics | Rating | Rank | Unemployment Among Ages 45 to 54 years |
| Norwegians | 100.0 /100 | #3 | Exceptional 3.9% |
| Immigrants | India | 100.0 /100 | #4 | Exceptional 3.9% |
| Danes | 100.0 /100 | #5 | Exceptional 3.9% |
| Immigrants | Cuba | 100.0 /100 | #6 | Exceptional 3.9% |
| Immigrants | Venezuela | 100.0 /100 | #7 | Exceptional 3.9% |
| Chinese | 100.0 /100 | #8 | Exceptional 4.0% |
| Czechs | 100.0 /100 | #9 | Exceptional 4.0% |
| Venezuelans | 100.0 /100 | #10 | Exceptional 4.0% |
| Scandinavians | 100.0 /100 | #11 | Exceptional 4.0% |
| Swedes | 100.0 /100 | #12 | Exceptional 4.0% |
| Cubans | 100.0 /100 | #13 | Exceptional 4.0% |
| Immigrants | Bosnia and Herzegovina | 100.0 /100 | #14 | Exceptional 4.0% |
| Immigrants | Bolivia | 100.0 /100 | #15 | Exceptional 4.0% |
| Thais | 100.0 /100 | #16 | Exceptional 4.0% |
| Tongans | 100.0 /100 | #17 | Exceptional 4.1% |