Alsatian vs Sioux Unemployment Among Women with Children Under 6 years
COMPARE
Alsatian
Sioux
Unemployment Among Women with Children Under 6 years
Unemployment Among Women with Children Under 6 years Comparison
Alsatians
Sioux
7.1%
UNEMPLOYMENT AMONG WOMEN WITH CHILDREN UNDER 6 YEARS
98.4/ 100
METRIC RATING
87th/ 347
METRIC RANK
11.5%
UNEMPLOYMENT AMONG WOMEN WITH CHILDREN UNDER 6 YEARS
0.0/ 100
METRIC RATING
332nd/ 347
METRIC RANK
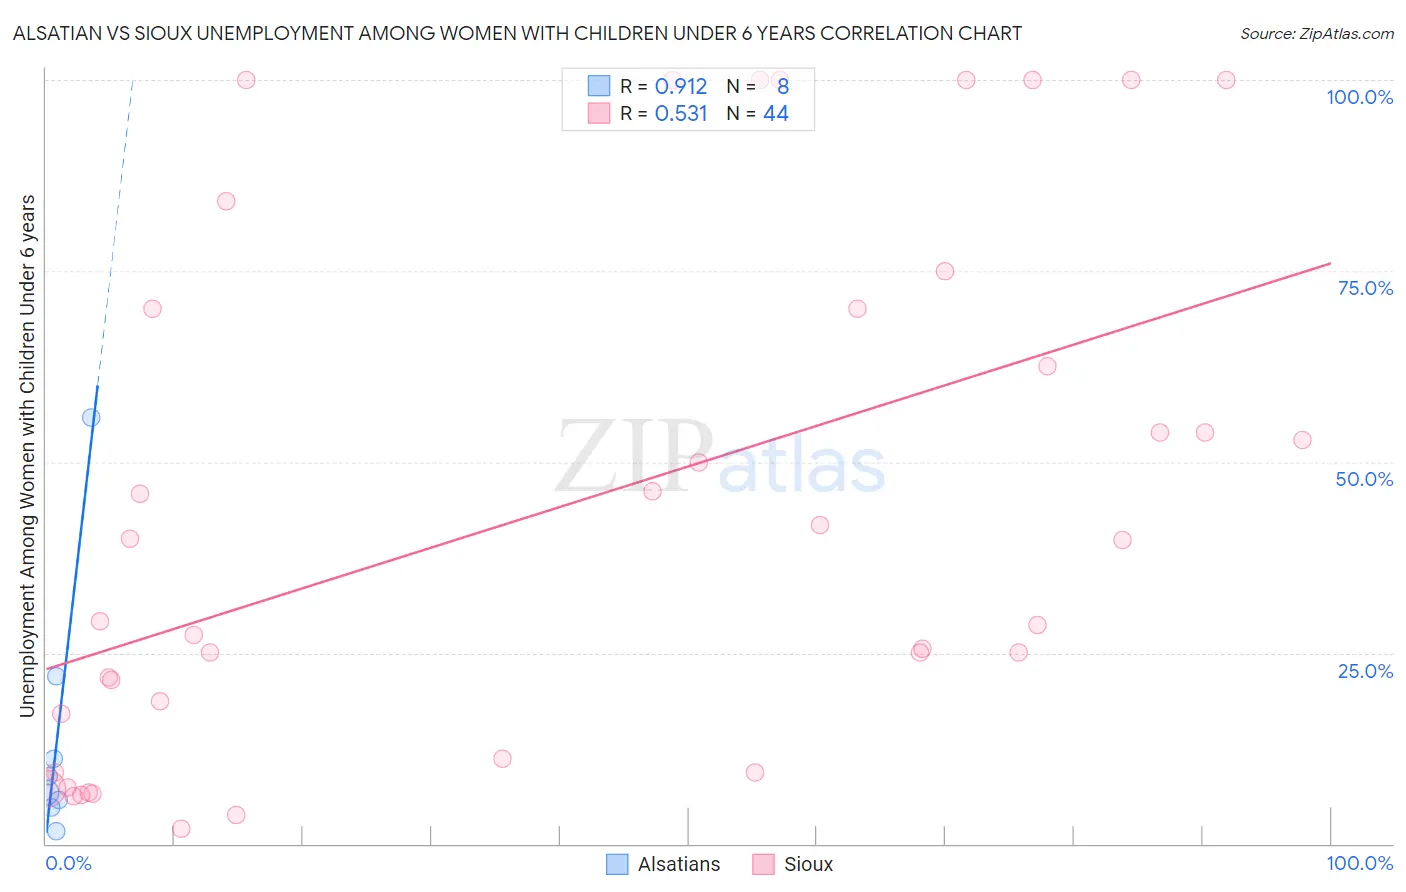
Alsatian vs Sioux Unemployment Among Women with Children Under 6 years Correlation Chart
The statistical analysis conducted on geographies consisting of 73,942,058 people shows a near-perfect positive correlation between the proportion of Alsatians and unemployment rate among women with children under the age of 6 in the United States with a correlation coefficient (R) of 0.912 and weighted average of 7.1%. Similarly, the statistical analysis conducted on geographies consisting of 190,203,570 people shows a substantial positive correlation between the proportion of Sioux and unemployment rate among women with children under the age of 6 in the United States with a correlation coefficient (R) of 0.531 and weighted average of 11.5%, a difference of 60.9%.
Unemployment Among Women with Children Under 6 years Correlation Summary
| Measurement | Alsatian | Sioux |
| Minimum | 1.6% | 2.0% |
| Maximum | 55.8% | 100.0% |
| Range | 54.2% | 98.0% |
| Mean | 14.6% | 43.8% |
| Median | 7.7% | 34.5% |
| Interquartile 25% (IQ1) | 5.3% | 14.1% |
| Interquartile 75% (IQ3) | 16.5% | 70.0% |
| Interquartile Range (IQR) | 11.3% | 55.9% |
| Standard Deviation (Sample) | 17.7% | 33.9% |
| Standard Deviation (Population) | 16.6% | 33.5% |
Similar Demographics by Unemployment Among Women with Children Under 6 years
Demographics Similar to Alsatians by Unemployment Among Women with Children Under 6 years
In terms of unemployment among women with children under 6 years, the demographic groups most similar to Alsatians are Immigrants from Hungary (7.1%, a difference of 0.12%), Immigrants from Zimbabwe (7.1%, a difference of 0.15%), Immigrants from Denmark (7.1%, a difference of 0.16%), Immigrants from Spain (7.1%, a difference of 0.22%), and Immigrants from Romania (7.1%, a difference of 0.28%).
| Demographics | Rating | Rank | Unemployment Among Women with Children Under 6 years |
| Immigrants | Greece | 98.9 /100 | #80 | Exceptional 7.1% |
| Immigrants | Venezuela | 98.8 /100 | #81 | Exceptional 7.1% |
| Immigrants | Afghanistan | 98.7 /100 | #82 | Exceptional 7.1% |
| Egyptians | 98.7 /100 | #83 | Exceptional 7.1% |
| Immigrants | Albania | 98.7 /100 | #84 | Exceptional 7.1% |
| Immigrants | Romania | 98.7 /100 | #85 | Exceptional 7.1% |
| Immigrants | Zimbabwe | 98.6 /100 | #86 | Exceptional 7.1% |
| Alsatians | 98.4 /100 | #87 | Exceptional 7.1% |
| Immigrants | Hungary | 98.3 /100 | #88 | Exceptional 7.1% |
| Immigrants | Denmark | 98.3 /100 | #89 | Exceptional 7.1% |
| Immigrants | Spain | 98.2 /100 | #90 | Exceptional 7.1% |
| Danes | 98.2 /100 | #91 | Exceptional 7.1% |
| Albanians | 98.0 /100 | #92 | Exceptional 7.2% |
| New Zealanders | 97.8 /100 | #93 | Exceptional 7.2% |
| Macedonians | 97.7 /100 | #94 | Exceptional 7.2% |
Demographics Similar to Sioux by Unemployment Among Women with Children Under 6 years
In terms of unemployment among women with children under 6 years, the demographic groups most similar to Sioux are Native/Alaskan (11.5%, a difference of 0.56%), Colville (11.2%, a difference of 2.7%), Pennsylvania German (10.8%, a difference of 6.4%), Apache (12.3%, a difference of 7.5%), and Puerto Rican (12.5%, a difference of 9.5%).
| Demographics | Rating | Rank | Unemployment Among Women with Children Under 6 years |
| Choctaw | 0.0 /100 | #325 | Tragic 9.8% |
| Delaware | 0.0 /100 | #326 | Tragic 9.8% |
| Ottawa | 0.0 /100 | #327 | Tragic 9.9% |
| Tohono O'odham | 0.0 /100 | #328 | Tragic 10.2% |
| Blacks/African Americans | 0.0 /100 | #329 | Tragic 10.3% |
| Pennsylvania Germans | 0.0 /100 | #330 | Tragic 10.8% |
| Colville | 0.0 /100 | #331 | Tragic 11.2% |
| Sioux | 0.0 /100 | #332 | Tragic 11.5% |
| Natives/Alaskans | 0.0 /100 | #333 | Tragic 11.5% |
| Apache | 0.0 /100 | #334 | Tragic 12.3% |
| Puerto Ricans | 0.0 /100 | #335 | Tragic 12.5% |
| Shoshone | 0.0 /100 | #336 | Tragic 13.2% |
| Chippewa | 0.0 /100 | #337 | Tragic 13.3% |
| Pima | 0.0 /100 | #338 | Tragic 13.4% |
| Navajo | 0.0 /100 | #339 | Tragic 13.5% |