Alsatian vs Armenian Unemployment Among Youth under 25 years
COMPARE
Alsatian
Armenian
Unemployment Among Youth under 25 years
Unemployment Among Youth under 25 years Comparison
Alsatians
Armenians
11.9%
UNEMPLOYMENT AMONG YOUTH UNDER 25 YEARS
6.1/ 100
METRIC RATING
220th/ 347
METRIC RANK
13.3%
UNEMPLOYMENT AMONG YOUTH UNDER 25 YEARS
0.0/ 100
METRIC RATING
281st/ 347
METRIC RANK
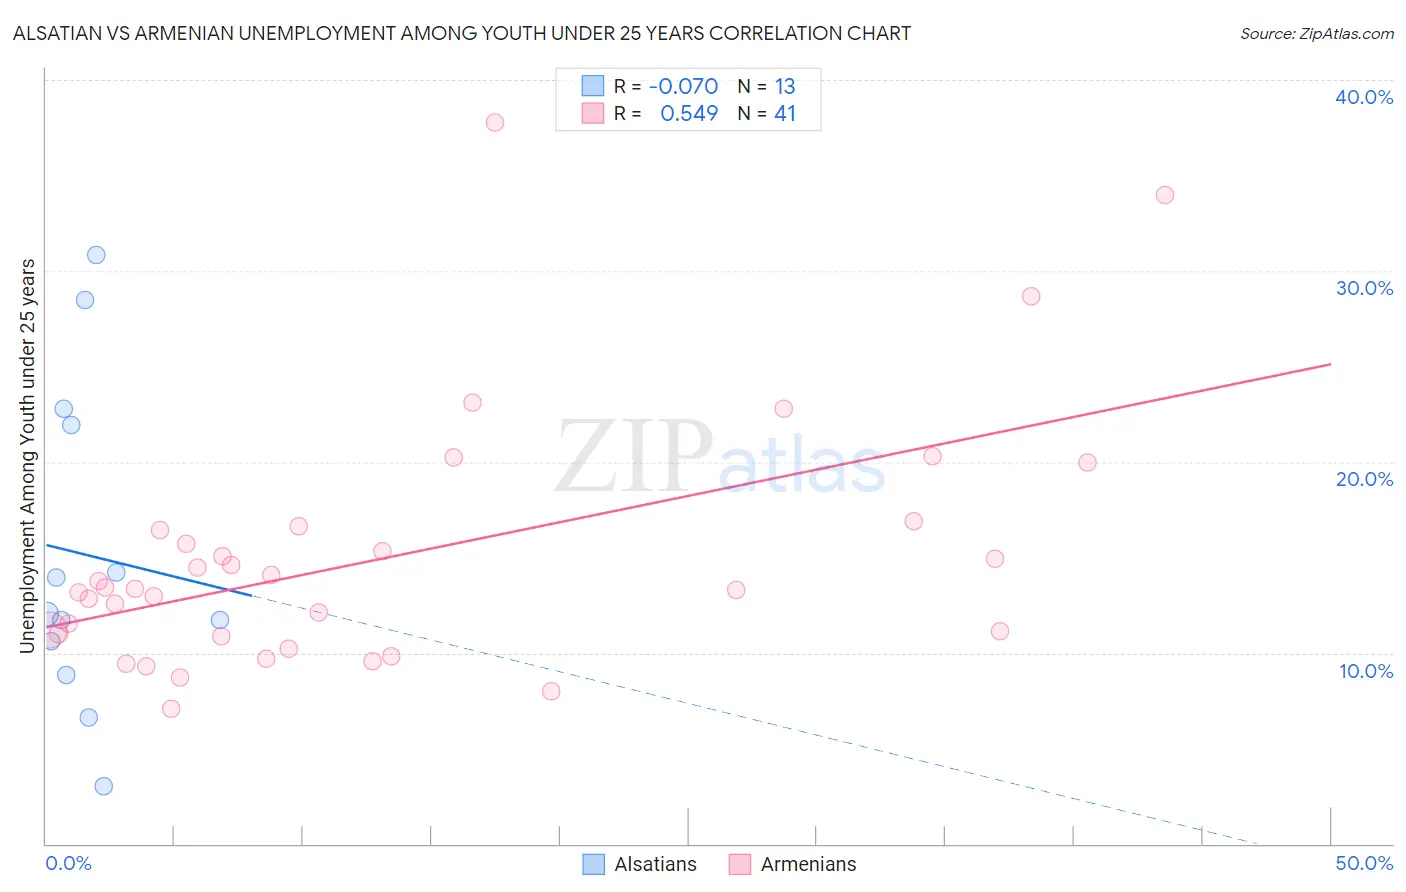
Alsatian vs Armenian Unemployment Among Youth under 25 years Correlation Chart
The statistical analysis conducted on geographies consisting of 82,312,882 people shows a slight negative correlation between the proportion of Alsatians and unemployment rate among youth under the age of 25 in the United States with a correlation coefficient (R) of -0.070 and weighted average of 11.9%. Similarly, the statistical analysis conducted on geographies consisting of 307,706,627 people shows a substantial positive correlation between the proportion of Armenians and unemployment rate among youth under the age of 25 in the United States with a correlation coefficient (R) of 0.549 and weighted average of 13.3%, a difference of 11.3%.
Unemployment Among Youth under 25 years Correlation Summary
| Measurement | Alsatian | Armenian |
| Minimum | 3.0% | 7.1% |
| Maximum | 30.8% | 37.8% |
| Range | 27.8% | 30.7% |
| Mean | 15.1% | 15.0% |
| Median | 12.0% | 13.3% |
| Interquartile 25% (IQ1) | 9.7% | 10.9% |
| Interquartile 75% (IQ3) | 22.4% | 16.5% |
| Interquartile Range (IQR) | 12.6% | 5.6% |
| Standard Deviation (Sample) | 8.4% | 6.6% |
| Standard Deviation (Population) | 8.1% | 6.5% |
Similar Demographics by Unemployment Among Youth under 25 years
Demographics Similar to Alsatians by Unemployment Among Youth under 25 years
In terms of unemployment among youth under 25 years, the demographic groups most similar to Alsatians are Nonimmigrants (11.9%, a difference of 0.020%), Immigrants from Middle Africa (11.9%, a difference of 0.13%), Yaqui (11.9%, a difference of 0.14%), Guamanian/Chamorro (11.9%, a difference of 0.15%), and Samoan (11.9%, a difference of 0.21%).
| Demographics | Rating | Rank | Unemployment Among Youth under 25 years |
| South Americans | 8.5 /100 | #213 | Tragic 11.9% |
| Costa Ricans | 8.2 /100 | #214 | Tragic 11.9% |
| Samoans | 7.4 /100 | #215 | Tragic 11.9% |
| Guamanians/Chamorros | 7.0 /100 | #216 | Tragic 11.9% |
| Yaqui | 6.9 /100 | #217 | Tragic 11.9% |
| Immigrants | Middle Africa | 6.8 /100 | #218 | Tragic 11.9% |
| Immigrants | Nonimmigrants | 6.2 /100 | #219 | Tragic 11.9% |
| Alsatians | 6.1 /100 | #220 | Tragic 11.9% |
| Immigrants | Portugal | 4.9 /100 | #221 | Tragic 12.0% |
| Israelis | 4.1 /100 | #222 | Tragic 12.0% |
| Immigrants | Ireland | 3.5 /100 | #223 | Tragic 12.0% |
| Hawaiians | 3.5 /100 | #224 | Tragic 12.0% |
| Immigrants | Ukraine | 3.0 /100 | #225 | Tragic 12.0% |
| Immigrants | Israel | 2.6 /100 | #226 | Tragic 12.0% |
| Immigrants | Iran | 2.6 /100 | #227 | Tragic 12.0% |
Demographics Similar to Armenians by Unemployment Among Youth under 25 years
In terms of unemployment among youth under 25 years, the demographic groups most similar to Armenians are Sierra Leonean (13.3%, a difference of 0.010%), Ute (13.3%, a difference of 0.030%), Immigrants from Cameroon (13.3%, a difference of 0.030%), Lumbee (13.3%, a difference of 0.050%), and Ghanaian (13.3%, a difference of 0.13%).
| Demographics | Rating | Rank | Unemployment Among Youth under 25 years |
| Immigrants | Nigeria | 0.0 /100 | #274 | Tragic 13.0% |
| Bermudans | 0.0 /100 | #275 | Tragic 13.0% |
| Immigrants | Uzbekistan | 0.0 /100 | #276 | Tragic 13.1% |
| Bahamians | 0.0 /100 | #277 | Tragic 13.1% |
| Africans | 0.0 /100 | #278 | Tragic 13.2% |
| Cajuns | 0.0 /100 | #279 | Tragic 13.2% |
| Ute | 0.0 /100 | #280 | Tragic 13.3% |
| Armenians | 0.0 /100 | #281 | Tragic 13.3% |
| Sierra Leoneans | 0.0 /100 | #282 | Tragic 13.3% |
| Immigrants | Cameroon | 0.0 /100 | #283 | Tragic 13.3% |
| Lumbee | 0.0 /100 | #284 | Tragic 13.3% |
| Ghanaians | 0.0 /100 | #285 | Tragic 13.3% |
| Blackfeet | 0.0 /100 | #286 | Tragic 13.3% |
| Ecuadorians | 0.0 /100 | #287 | Tragic 13.3% |
| Immigrants | Western Africa | 0.0 /100 | #288 | Tragic 13.4% |