Aleut vs Scandinavian Unemployment Among Ages 30 to 34 years
COMPARE
Aleut
Scandinavian
Unemployment Among Ages 30 to 34 years
Unemployment Among Ages 30 to 34 years Comparison
Aleuts
Scandinavians
7.1%
UNEMPLOYMENT AMONG AGES 30 TO 34 YEARS
0.0/ 100
METRIC RATING
315th/ 347
METRIC RANK
5.2%
UNEMPLOYMENT AMONG AGES 30 TO 34 YEARS
95.6/ 100
METRIC RATING
76th/ 347
METRIC RANK
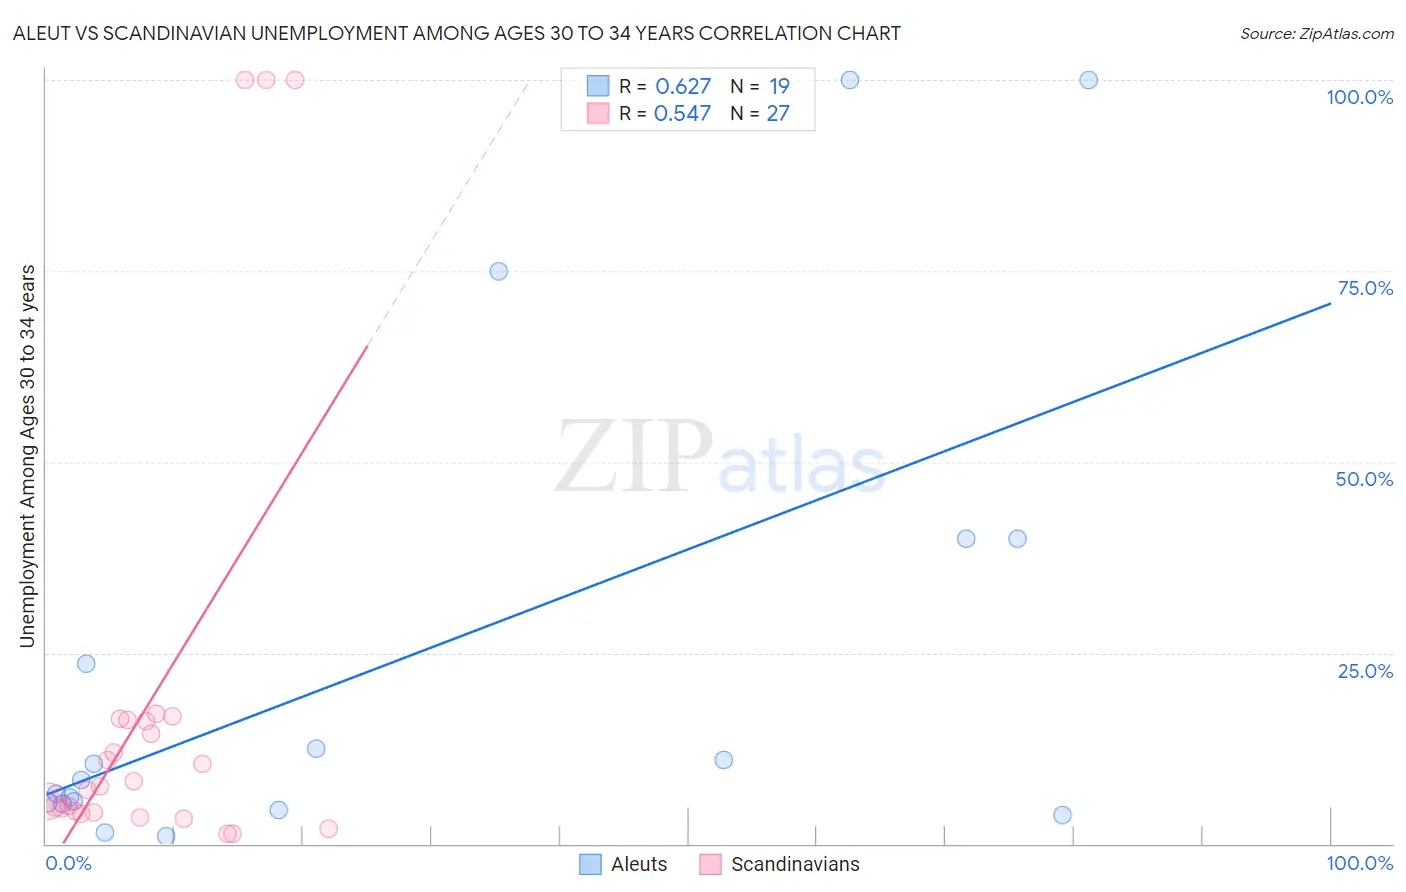
Aleut vs Scandinavian Unemployment Among Ages 30 to 34 years Correlation Chart
The statistical analysis conducted on geographies consisting of 60,709,035 people shows a significant positive correlation between the proportion of Aleuts and unemployment rate among population between the ages 30 and 34 in the United States with a correlation coefficient (R) of 0.627 and weighted average of 7.1%. Similarly, the statistical analysis conducted on geographies consisting of 427,904,410 people shows a substantial positive correlation between the proportion of Scandinavians and unemployment rate among population between the ages 30 and 34 in the United States with a correlation coefficient (R) of 0.547 and weighted average of 5.2%, a difference of 37.0%.
Unemployment Among Ages 30 to 34 years Correlation Summary
| Measurement | Aleut | Scandinavian |
| Minimum | 1.0% | 1.3% |
| Maximum | 100.0% | 100.0% |
| Range | 99.0% | 98.7% |
| Mean | 24.2% | 18.4% |
| Median | 8.3% | 7.6% |
| Interquartile 25% (IQ1) | 5.3% | 4.1% |
| Interquartile 75% (IQ3) | 40.0% | 16.2% |
| Interquartile Range (IQR) | 34.7% | 12.0% |
| Standard Deviation (Sample) | 32.4% | 29.8% |
| Standard Deviation (Population) | 31.5% | 29.3% |
Similar Demographics by Unemployment Among Ages 30 to 34 years
Demographics Similar to Aleuts by Unemployment Among Ages 30 to 34 years
In terms of unemployment among ages 30 to 34 years, the demographic groups most similar to Aleuts are Lumbee (7.1%, a difference of 0.37%), Ute (7.0%, a difference of 0.58%), British West Indian (7.0%, a difference of 0.62%), Alaskan Athabascan (7.0%, a difference of 0.69%), and Houma (7.2%, a difference of 1.0%).
| Demographics | Rating | Rank | Unemployment Among Ages 30 to 34 years |
| Immigrants | Azores | 0.0 /100 | #308 | Tragic 6.9% |
| Immigrants | Grenada | 0.0 /100 | #309 | Tragic 6.9% |
| Immigrants | St. Vincent and the Grenadines | 0.0 /100 | #310 | Tragic 7.0% |
| Alaskan Athabascans | 0.0 /100 | #311 | Tragic 7.0% |
| British West Indians | 0.0 /100 | #312 | Tragic 7.0% |
| Ute | 0.0 /100 | #313 | Tragic 7.0% |
| Lumbee | 0.0 /100 | #314 | Tragic 7.1% |
| Aleuts | 0.0 /100 | #315 | Tragic 7.1% |
| Houma | 0.0 /100 | #316 | Tragic 7.2% |
| Immigrants | Cabo Verde | 0.0 /100 | #317 | Tragic 7.2% |
| Blacks/African Americans | 0.0 /100 | #318 | Tragic 7.2% |
| Guyanese | 0.0 /100 | #319 | Tragic 7.2% |
| Cape Verdeans | 0.0 /100 | #320 | Tragic 7.2% |
| Immigrants | Guyana | 0.0 /100 | #321 | Tragic 7.2% |
| Marshallese | 0.0 /100 | #322 | Tragic 7.2% |
Demographics Similar to Scandinavians by Unemployment Among Ages 30 to 34 years
In terms of unemployment among ages 30 to 34 years, the demographic groups most similar to Scandinavians are Uruguayan (5.2%, a difference of 0.070%), Indonesian (5.2%, a difference of 0.20%), Iranian (5.2%, a difference of 0.21%), Immigrants from Lithuania (5.2%, a difference of 0.25%), and Immigrants from Asia (5.2%, a difference of 0.27%).
| Demographics | Rating | Rank | Unemployment Among Ages 30 to 34 years |
| Immigrants | Northern Africa | 96.4 /100 | #69 | Exceptional 5.1% |
| Immigrants | Iraq | 96.4 /100 | #70 | Exceptional 5.1% |
| Paraguayans | 96.4 /100 | #71 | Exceptional 5.1% |
| Immigrants | Moldova | 96.4 /100 | #72 | Exceptional 5.1% |
| Slovenes | 96.2 /100 | #73 | Exceptional 5.2% |
| Immigrants | Asia | 96.2 /100 | #74 | Exceptional 5.2% |
| Iranians | 96.0 /100 | #75 | Exceptional 5.2% |
| Scandinavians | 95.6 /100 | #76 | Exceptional 5.2% |
| Uruguayans | 95.4 /100 | #77 | Exceptional 5.2% |
| Indonesians | 95.1 /100 | #78 | Exceptional 5.2% |
| Immigrants | Lithuania | 95.0 /100 | #79 | Exceptional 5.2% |
| Immigrants | Indonesia | 94.7 /100 | #80 | Exceptional 5.2% |
| Chileans | 94.4 /100 | #81 | Exceptional 5.2% |
| Immigrants | Latvia | 94.2 /100 | #82 | Exceptional 5.2% |
| Immigrants | Korea | 94.1 /100 | #83 | Exceptional 5.2% |