Aleut vs Immigrants from England Unemployment Among Ages 25 to 29 years
COMPARE
Aleut
Immigrants from England
Unemployment Among Ages 25 to 29 years
Unemployment Among Ages 25 to 29 years Comparison
Aleuts
Immigrants from England
9.7%
UNEMPLOYMENT AMONG AGES 25 TO 29 YEARS
0.0/ 100
METRIC RATING
329th/ 347
METRIC RANK
6.8%
UNEMPLOYMENT AMONG AGES 25 TO 29 YEARS
19.8/ 100
METRIC RATING
205th/ 347
METRIC RANK
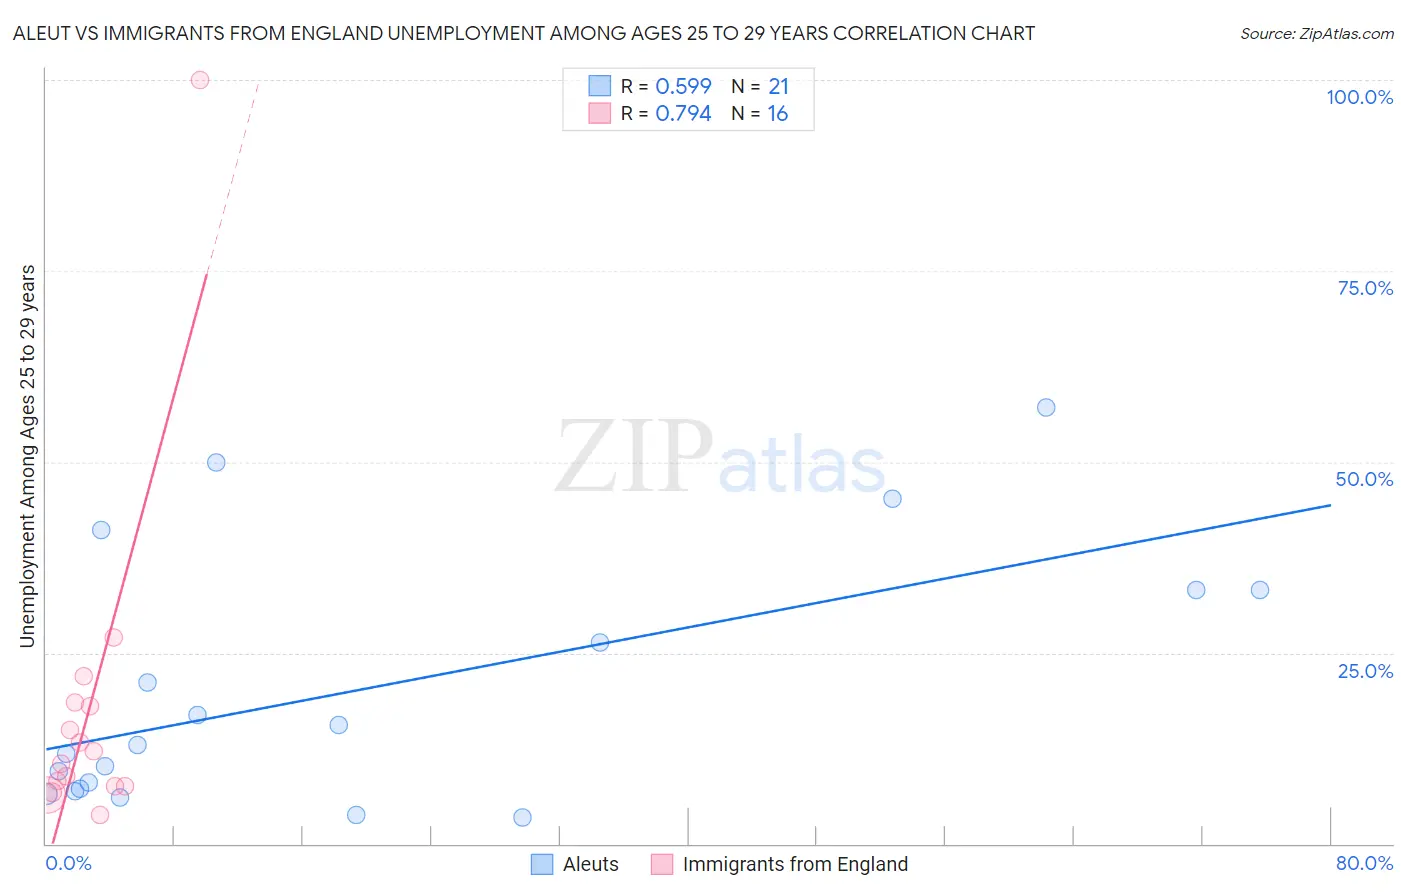
Aleut vs Immigrants from England Unemployment Among Ages 25 to 29 years Correlation Chart
The statistical analysis conducted on geographies consisting of 60,840,532 people shows a substantial positive correlation between the proportion of Aleuts and unemployment rate among population between the ages 25 and 29 in the United States with a correlation coefficient (R) of 0.599 and weighted average of 9.7%. Similarly, the statistical analysis conducted on geographies consisting of 370,546,883 people shows a strong positive correlation between the proportion of Immigrants from England and unemployment rate among population between the ages 25 and 29 in the United States with a correlation coefficient (R) of 0.794 and weighted average of 6.8%, a difference of 42.7%.
Unemployment Among Ages 25 to 29 years Correlation Summary
| Measurement | Aleut | Immigrants from England |
| Minimum | 3.4% | 3.8% |
| Maximum | 57.1% | 100.0% |
| Range | 53.7% | 96.2% |
| Mean | 20.3% | 17.8% |
| Median | 12.9% | 11.2% |
| Interquartile 25% (IQ1) | 7.0% | 7.6% |
| Interquartile 75% (IQ3) | 33.3% | 18.3% |
| Interquartile Range (IQR) | 26.3% | 10.7% |
| Standard Deviation (Sample) | 16.6% | 22.8% |
| Standard Deviation (Population) | 16.2% | 22.1% |
Similar Demographics by Unemployment Among Ages 25 to 29 years
Demographics Similar to Aleuts by Unemployment Among Ages 25 to 29 years
In terms of unemployment among ages 25 to 29 years, the demographic groups most similar to Aleuts are Native/Alaskan (9.8%, a difference of 1.4%), Apache (9.5%, a difference of 2.2%), Colville (9.2%, a difference of 4.9%), Shoshone (9.2%, a difference of 5.0%), and Alaska Native (10.2%, a difference of 5.2%).
| Demographics | Rating | Rank | Unemployment Among Ages 25 to 29 years |
| Tlingit-Haida | 0.0 /100 | #322 | Tragic 8.7% |
| Dominicans | 0.0 /100 | #323 | Tragic 8.7% |
| Houma | 0.0 /100 | #324 | Tragic 8.7% |
| Yakama | 0.0 /100 | #325 | Tragic 8.8% |
| Shoshone | 0.0 /100 | #326 | Tragic 9.2% |
| Colville | 0.0 /100 | #327 | Tragic 9.2% |
| Apache | 0.0 /100 | #328 | Tragic 9.5% |
| Aleuts | 0.0 /100 | #329 | Tragic 9.7% |
| Natives/Alaskans | 0.0 /100 | #330 | Tragic 9.8% |
| Alaska Natives | 0.0 /100 | #331 | Tragic 10.2% |
| Pueblo | 0.0 /100 | #332 | Tragic 10.4% |
| Alaskan Athabascans | 0.0 /100 | #333 | Tragic 10.8% |
| Yuman | 0.0 /100 | #334 | Tragic 11.0% |
| Puerto Ricans | 0.0 /100 | #335 | Tragic 11.1% |
| Lumbee | 0.0 /100 | #336 | Tragic 11.2% |
Demographics Similar to Immigrants from England by Unemployment Among Ages 25 to 29 years
In terms of unemployment among ages 25 to 29 years, the demographic groups most similar to Immigrants from England are Scotch-Irish (6.8%, a difference of 0.010%), Ugandan (6.8%, a difference of 0.010%), Immigrants from Denmark (6.8%, a difference of 0.080%), Immigrants from Germany (6.8%, a difference of 0.10%), and Immigrants from Norway (6.8%, a difference of 0.13%).
| Demographics | Rating | Rank | Unemployment Among Ages 25 to 29 years |
| Immigrants | Southern Europe | 24.6 /100 | #198 | Fair 6.8% |
| Guamanians/Chamorros | 24.3 /100 | #199 | Fair 6.8% |
| South American Indians | 23.3 /100 | #200 | Fair 6.8% |
| Basques | 22.5 /100 | #201 | Fair 6.8% |
| Immigrants | Argentina | 21.6 /100 | #202 | Fair 6.8% |
| Immigrants | Norway | 21.2 /100 | #203 | Fair 6.8% |
| Scotch-Irish | 20.0 /100 | #204 | Poor 6.8% |
| Immigrants | England | 19.8 /100 | #205 | Poor 6.8% |
| Ugandans | 19.8 /100 | #206 | Poor 6.8% |
| Immigrants | Denmark | 19.0 /100 | #207 | Poor 6.8% |
| Immigrants | Germany | 18.8 /100 | #208 | Poor 6.8% |
| Hawaiians | 17.1 /100 | #209 | Poor 6.8% |
| Canadians | 16.9 /100 | #210 | Poor 6.8% |
| Immigrants | Philippines | 16.7 /100 | #211 | Poor 6.8% |
| Immigrants | Cabo Verde | 16.2 /100 | #212 | Poor 6.8% |