Albanian vs Immigrants from Taiwan Unemployment Among Ages 16 to 19 years
COMPARE
Albanian
Immigrants from Taiwan
Unemployment Among Ages 16 to 19 years
Unemployment Among Ages 16 to 19 years Comparison
Albanians
Immigrants from Taiwan
18.2%
UNEMPLOYMENT AMONG AGES 16 TO 19 YEARS
5.8/ 100
METRIC RATING
229th/ 347
METRIC RANK
15.8%
UNEMPLOYMENT AMONG AGES 16 TO 19 YEARS
100.0/ 100
METRIC RATING
21st/ 347
METRIC RANK
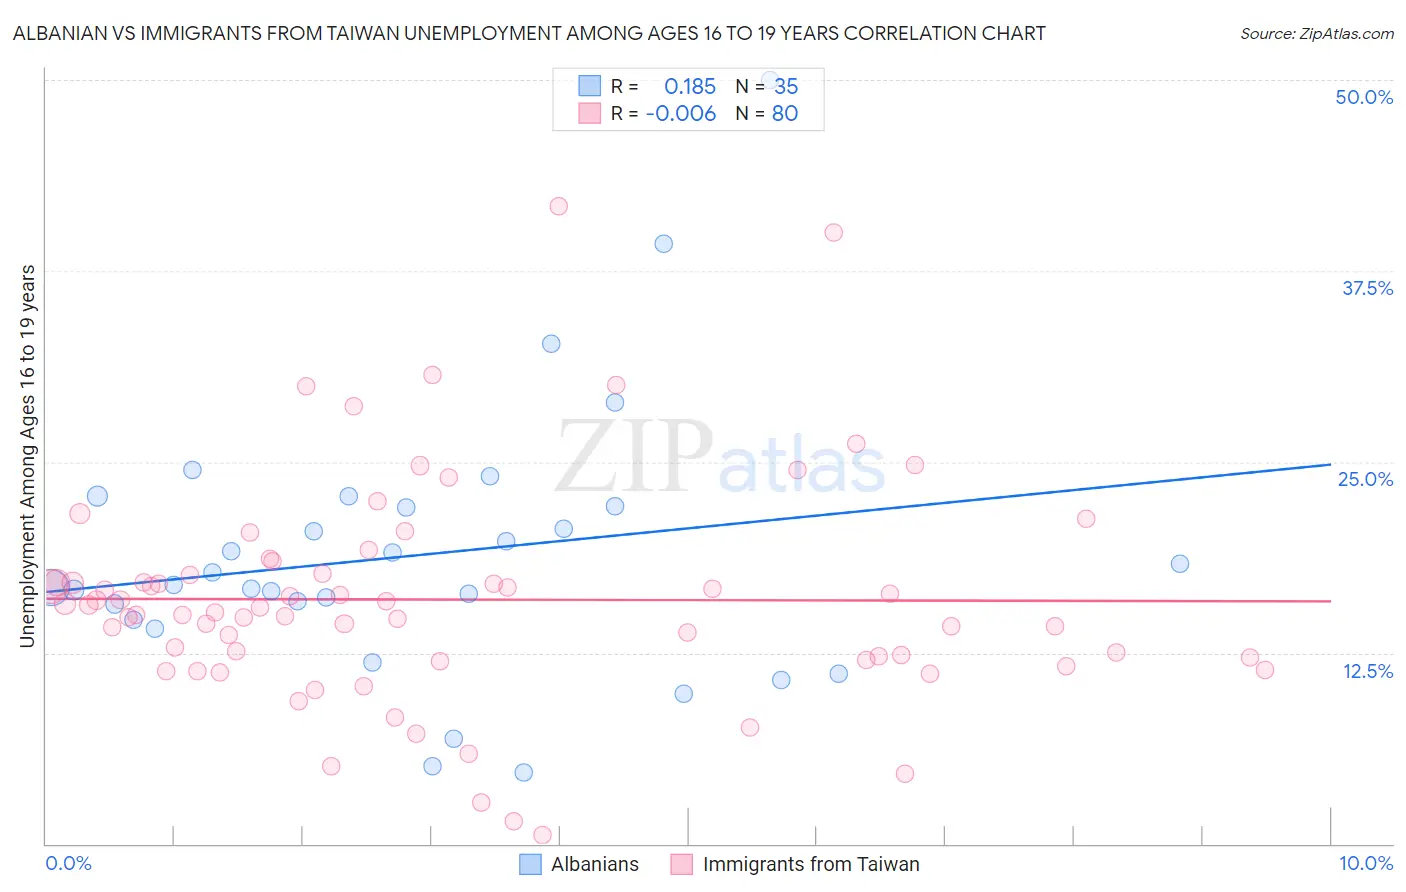
Albanian vs Immigrants from Taiwan Unemployment Among Ages 16 to 19 years Correlation Chart
The statistical analysis conducted on geographies consisting of 186,358,251 people shows a poor positive correlation between the proportion of Albanians and unemployment rate among population between the ages 16 and 19 in the United States with a correlation coefficient (R) of 0.185 and weighted average of 18.2%. Similarly, the statistical analysis conducted on geographies consisting of 286,729,019 people shows no correlation between the proportion of Immigrants from Taiwan and unemployment rate among population between the ages 16 and 19 in the United States with a correlation coefficient (R) of -0.006 and weighted average of 15.8%, a difference of 14.7%.
Unemployment Among Ages 16 to 19 years Correlation Summary
| Measurement | Albanian | Immigrants from Taiwan |
| Minimum | 4.7% | 0.60% |
| Maximum | 50.0% | 41.8% |
| Range | 45.3% | 41.2% |
| Mean | 18.9% | 16.0% |
| Median | 16.9% | 15.3% |
| Interquartile 25% (IQ1) | 14.7% | 12.1% |
| Interquartile 75% (IQ3) | 22.1% | 17.6% |
| Interquartile Range (IQR) | 7.4% | 5.5% |
| Standard Deviation (Sample) | 8.9% | 7.2% |
| Standard Deviation (Population) | 8.8% | 7.2% |
Similar Demographics by Unemployment Among Ages 16 to 19 years
Demographics Similar to Albanians by Unemployment Among Ages 16 to 19 years
In terms of unemployment among ages 16 to 19 years, the demographic groups most similar to Albanians are Immigrants from Greece (18.1%, a difference of 0.25%), Immigrants from Liberia (18.1%, a difference of 0.26%), Spanish American (18.2%, a difference of 0.26%), Immigrants from Belgium (18.1%, a difference of 0.28%), and Immigrants from Chile (18.1%, a difference of 0.32%).
| Demographics | Rating | Rank | Unemployment Among Ages 16 to 19 years |
| Immigrants | Iran | 10.7 /100 | #222 | Poor 18.0% |
| Immigrants | Western Asia | 10.2 /100 | #223 | Poor 18.0% |
| Immigrants | Serbia | 8.3 /100 | #224 | Tragic 18.1% |
| Immigrants | Chile | 7.5 /100 | #225 | Tragic 18.1% |
| Immigrants | Belgium | 7.3 /100 | #226 | Tragic 18.1% |
| Immigrants | Liberia | 7.1 /100 | #227 | Tragic 18.1% |
| Immigrants | Greece | 7.1 /100 | #228 | Tragic 18.1% |
| Albanians | 5.8 /100 | #229 | Tragic 18.2% |
| Spanish Americans | 4.7 /100 | #230 | Tragic 18.2% |
| Nepalese | 4.2 /100 | #231 | Tragic 18.2% |
| Immigrants | Russia | 4.0 /100 | #232 | Tragic 18.2% |
| Seminole | 4.0 /100 | #233 | Tragic 18.2% |
| Colombians | 3.7 /100 | #234 | Tragic 18.3% |
| French American Indians | 2.9 /100 | #235 | Tragic 18.3% |
| Immigrants | Colombia | 2.7 /100 | #236 | Tragic 18.3% |
Demographics Similar to Immigrants from Taiwan by Unemployment Among Ages 16 to 19 years
In terms of unemployment among ages 16 to 19 years, the demographic groups most similar to Immigrants from Taiwan are Sudanese (15.8%, a difference of 0.33%), Finnish (15.9%, a difference of 0.36%), Belgian (15.9%, a difference of 0.40%), Swiss (15.8%, a difference of 0.42%), and Thai (15.7%, a difference of 0.54%).
| Demographics | Rating | Rank | Unemployment Among Ages 16 to 19 years |
| Immigrants | Zaire | 100.0 /100 | #14 | Exceptional 15.6% |
| Yugoslavians | 100.0 /100 | #15 | Exceptional 15.6% |
| Germans | 100.0 /100 | #16 | Exceptional 15.7% |
| Somalis | 100.0 /100 | #17 | Exceptional 15.7% |
| Thais | 100.0 /100 | #18 | Exceptional 15.7% |
| Swiss | 100.0 /100 | #19 | Exceptional 15.8% |
| Sudanese | 100.0 /100 | #20 | Exceptional 15.8% |
| Immigrants | Taiwan | 100.0 /100 | #21 | Exceptional 15.8% |
| Finns | 100.0 /100 | #22 | Exceptional 15.9% |
| Belgians | 100.0 /100 | #23 | Exceptional 15.9% |
| Tongans | 100.0 /100 | #24 | Exceptional 15.9% |
| Filipinos | 100.0 /100 | #25 | Exceptional 15.9% |
| Dutch | 100.0 /100 | #26 | Exceptional 15.9% |
| Immigrants | Sudan | 99.9 /100 | #27 | Exceptional 16.0% |
| Jordanians | 99.9 /100 | #28 | Exceptional 16.0% |