Alaskan Athabascan vs Slovene Unemployment Among Ages 30 to 34 years
COMPARE
Alaskan Athabascan
Slovene
Unemployment Among Ages 30 to 34 years
Unemployment Among Ages 30 to 34 years Comparison
Alaskan Athabascans
Slovenes
7.0%
UNEMPLOYMENT AMONG AGES 30 TO 34 YEARS
0.0/ 100
METRIC RATING
311th/ 347
METRIC RANK
5.2%
UNEMPLOYMENT AMONG AGES 30 TO 34 YEARS
96.2/ 100
METRIC RATING
73rd/ 347
METRIC RANK
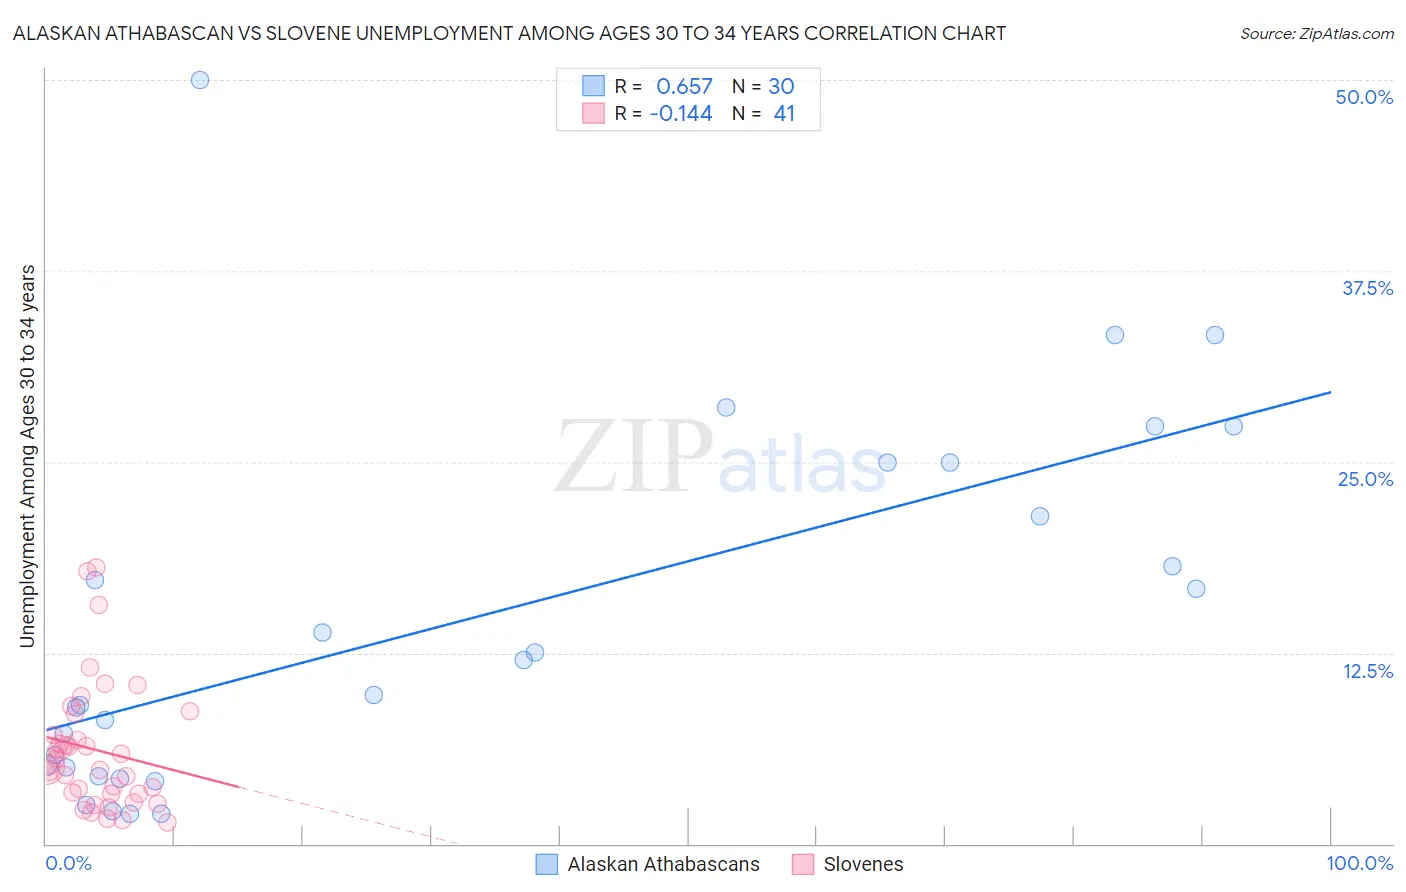
Alaskan Athabascan vs Slovene Unemployment Among Ages 30 to 34 years Correlation Chart
The statistical analysis conducted on geographies consisting of 45,103,886 people shows a significant positive correlation between the proportion of Alaskan Athabascans and unemployment rate among population between the ages 30 and 34 in the United States with a correlation coefficient (R) of 0.657 and weighted average of 7.0%. Similarly, the statistical analysis conducted on geographies consisting of 247,890,724 people shows a poor negative correlation between the proportion of Slovenes and unemployment rate among population between the ages 30 and 34 in the United States with a correlation coefficient (R) of -0.144 and weighted average of 5.2%, a difference of 36.5%.
Unemployment Among Ages 30 to 34 years Correlation Summary
| Measurement | Alaskan Athabascan | Slovene |
| Minimum | 1.9% | 1.4% |
| Maximum | 50.0% | 18.1% |
| Range | 48.1% | 16.7% |
| Mean | 14.7% | 6.1% |
| Median | 10.8% | 5.1% |
| Interquartile 25% (IQ1) | 5.0% | 3.3% |
| Interquartile 75% (IQ3) | 25.0% | 7.8% |
| Interquartile Range (IQR) | 20.0% | 4.6% |
| Standard Deviation (Sample) | 12.0% | 4.1% |
| Standard Deviation (Population) | 11.8% | 4.0% |
Similar Demographics by Unemployment Among Ages 30 to 34 years
Demographics Similar to Alaskan Athabascans by Unemployment Among Ages 30 to 34 years
In terms of unemployment among ages 30 to 34 years, the demographic groups most similar to Alaskan Athabascans are British West Indian (7.0%, a difference of 0.070%), Ute (7.0%, a difference of 0.12%), Lumbee (7.1%, a difference of 0.33%), Aleut (7.1%, a difference of 0.69%), and Immigrants from St. Vincent and the Grenadines (7.0%, a difference of 1.1%).
| Demographics | Rating | Rank | Unemployment Among Ages 30 to 34 years |
| Kiowa | 0.0 /100 | #304 | Tragic 6.7% |
| Paiute | 0.0 /100 | #305 | Tragic 6.7% |
| Immigrants | Armenia | 0.0 /100 | #306 | Tragic 6.8% |
| Immigrants | Belize | 0.0 /100 | #307 | Tragic 6.9% |
| Immigrants | Azores | 0.0 /100 | #308 | Tragic 6.9% |
| Immigrants | Grenada | 0.0 /100 | #309 | Tragic 6.9% |
| Immigrants | St. Vincent and the Grenadines | 0.0 /100 | #310 | Tragic 7.0% |
| Alaskan Athabascans | 0.0 /100 | #311 | Tragic 7.0% |
| British West Indians | 0.0 /100 | #312 | Tragic 7.0% |
| Ute | 0.0 /100 | #313 | Tragic 7.0% |
| Lumbee | 0.0 /100 | #314 | Tragic 7.1% |
| Aleuts | 0.0 /100 | #315 | Tragic 7.1% |
| Houma | 0.0 /100 | #316 | Tragic 7.2% |
| Immigrants | Cabo Verde | 0.0 /100 | #317 | Tragic 7.2% |
| Blacks/African Americans | 0.0 /100 | #318 | Tragic 7.2% |
Demographics Similar to Slovenes by Unemployment Among Ages 30 to 34 years
In terms of unemployment among ages 30 to 34 years, the demographic groups most similar to Slovenes are Immigrants from Asia (5.2%, a difference of 0.030%), Immigrants from Moldova (5.1%, a difference of 0.090%), Iranian (5.2%, a difference of 0.090%), Paraguayan (5.1%, a difference of 0.10%), and Immigrants from Northern Africa (5.1%, a difference of 0.11%).
| Demographics | Rating | Rank | Unemployment Among Ages 30 to 34 years |
| Immigrants | Zimbabwe | 96.7 /100 | #66 | Exceptional 5.1% |
| Burmese | 96.5 /100 | #67 | Exceptional 5.1% |
| Jordanians | 96.5 /100 | #68 | Exceptional 5.1% |
| Immigrants | Northern Africa | 96.4 /100 | #69 | Exceptional 5.1% |
| Immigrants | Iraq | 96.4 /100 | #70 | Exceptional 5.1% |
| Paraguayans | 96.4 /100 | #71 | Exceptional 5.1% |
| Immigrants | Moldova | 96.4 /100 | #72 | Exceptional 5.1% |
| Slovenes | 96.2 /100 | #73 | Exceptional 5.2% |
| Immigrants | Asia | 96.2 /100 | #74 | Exceptional 5.2% |
| Iranians | 96.0 /100 | #75 | Exceptional 5.2% |
| Scandinavians | 95.6 /100 | #76 | Exceptional 5.2% |
| Uruguayans | 95.4 /100 | #77 | Exceptional 5.2% |
| Indonesians | 95.1 /100 | #78 | Exceptional 5.2% |
| Immigrants | Lithuania | 95.0 /100 | #79 | Exceptional 5.2% |
| Immigrants | Indonesia | 94.7 /100 | #80 | Exceptional 5.2% |