Alaska Native vs Inupiat Unemployment Among Ages 16 to 19 years
COMPARE
Alaska Native
Inupiat
Unemployment Among Ages 16 to 19 years
Unemployment Among Ages 16 to 19 years Comparison
Alaska Natives
Inupiat
21.8%
UNEMPLOYMENT AMONG AGES 16 TO 19 YEARS
0.0/ 100
METRIC RATING
314th/ 347
METRIC RANK
28.1%
UNEMPLOYMENT AMONG AGES 16 TO 19 YEARS
0.0/ 100
METRIC RATING
342nd/ 347
METRIC RANK
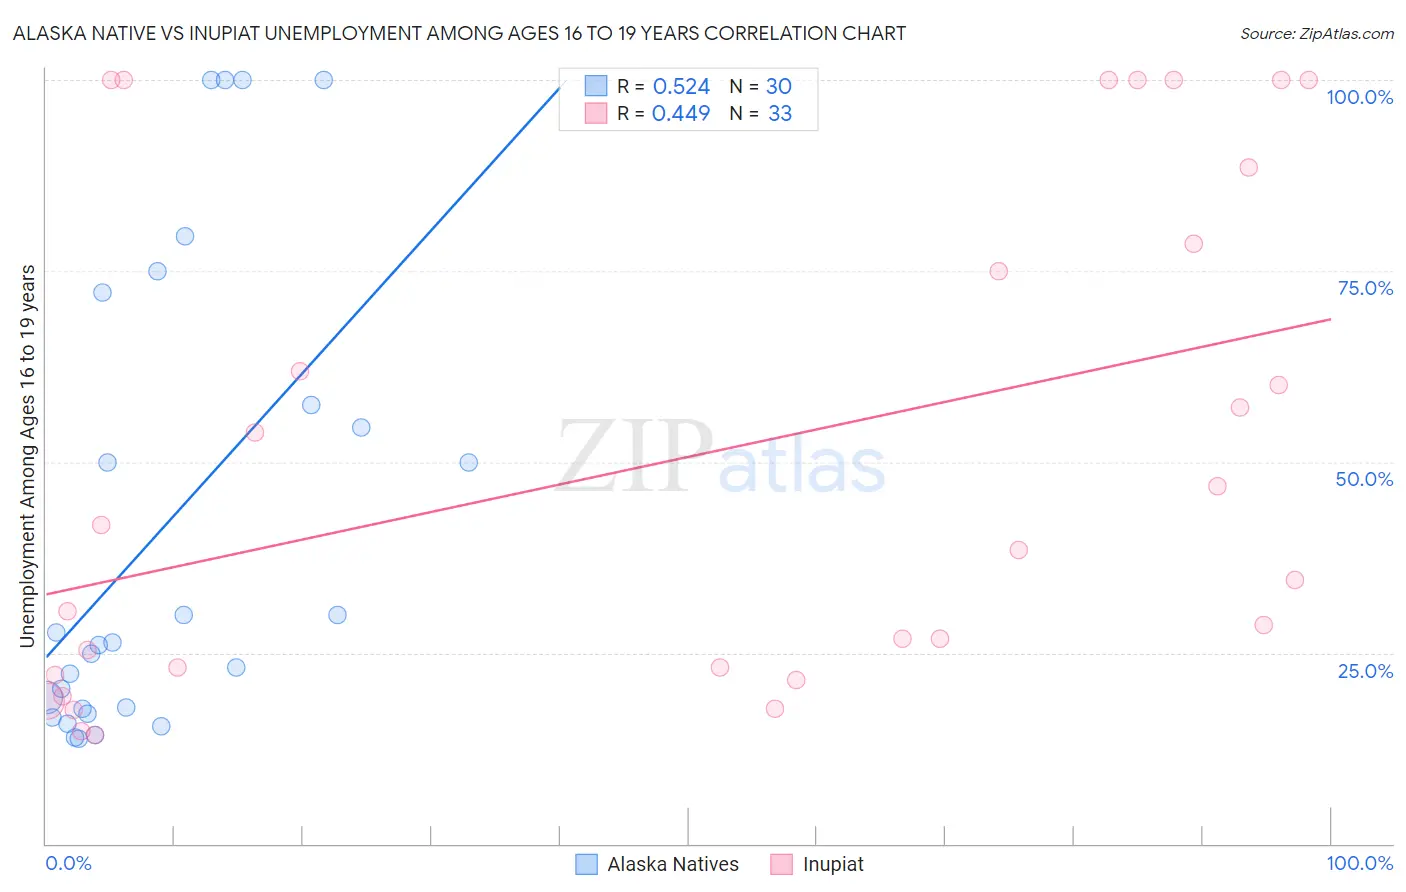
Alaska Native vs Inupiat Unemployment Among Ages 16 to 19 years Correlation Chart
The statistical analysis conducted on geographies consisting of 76,044,385 people shows a substantial positive correlation between the proportion of Alaska Natives and unemployment rate among population between the ages 16 and 19 in the United States with a correlation coefficient (R) of 0.524 and weighted average of 21.8%. Similarly, the statistical analysis conducted on geographies consisting of 94,709,407 people shows a moderate positive correlation between the proportion of Inupiat and unemployment rate among population between the ages 16 and 19 in the United States with a correlation coefficient (R) of 0.449 and weighted average of 28.1%, a difference of 29.0%.
Unemployment Among Ages 16 to 19 years Correlation Summary
| Measurement | Alaska Native | Inupiat |
| Minimum | 13.8% | 14.3% |
| Maximum | 100.0% | 100.0% |
| Range | 86.2% | 85.7% |
| Mean | 41.0% | 50.5% |
| Median | 26.2% | 38.5% |
| Interquartile 25% (IQ1) | 17.7% | 22.5% |
| Interquartile 75% (IQ3) | 57.5% | 83.6% |
| Interquartile Range (IQR) | 39.7% | 61.1% |
| Standard Deviation (Sample) | 30.3% | 32.3% |
| Standard Deviation (Population) | 29.8% | 31.8% |
Similar Demographics by Unemployment Among Ages 16 to 19 years
Demographics Similar to Alaska Natives by Unemployment Among Ages 16 to 19 years
In terms of unemployment among ages 16 to 19 years, the demographic groups most similar to Alaska Natives are Jamaican (21.7%, a difference of 0.16%), Houma (21.6%, a difference of 0.58%), Belizean (21.6%, a difference of 0.84%), Immigrants from Dominica (21.9%, a difference of 0.85%), and Vietnamese (21.5%, a difference of 1.1%).
| Demographics | Rating | Rank | Unemployment Among Ages 16 to 19 years |
| Blacks/African Americans | 0.0 /100 | #307 | Tragic 21.4% |
| Immigrants | Bangladesh | 0.0 /100 | #308 | Tragic 21.5% |
| Natives/Alaskans | 0.0 /100 | #309 | Tragic 21.5% |
| Vietnamese | 0.0 /100 | #310 | Tragic 21.5% |
| Belizeans | 0.0 /100 | #311 | Tragic 21.6% |
| Houma | 0.0 /100 | #312 | Tragic 21.6% |
| Jamaicans | 0.0 /100 | #313 | Tragic 21.7% |
| Alaska Natives | 0.0 /100 | #314 | Tragic 21.8% |
| Immigrants | Dominica | 0.0 /100 | #315 | Tragic 21.9% |
| Tohono O'odham | 0.0 /100 | #316 | Tragic 22.1% |
| Immigrants | Belize | 0.0 /100 | #317 | Tragic 22.2% |
| Immigrants | Jamaica | 0.0 /100 | #318 | Tragic 22.2% |
| Immigrants | West Indies | 0.0 /100 | #319 | Tragic 22.2% |
| Cheyenne | 0.0 /100 | #320 | Tragic 22.3% |
| West Indians | 0.0 /100 | #321 | Tragic 22.4% |
Demographics Similar to Inupiat by Unemployment Among Ages 16 to 19 years
In terms of unemployment among ages 16 to 19 years, the demographic groups most similar to Inupiat are Puerto Rican (27.5%, a difference of 2.0%), Navajo (29.0%, a difference of 3.5%), Colville (29.7%, a difference of 5.8%), Crow (26.2%, a difference of 6.9%), and Immigrants from Grenada (25.7%, a difference of 9.0%).
| Demographics | Rating | Rank | Unemployment Among Ages 16 to 19 years |
| Paiute | 0.0 /100 | #333 | Tragic 24.4% |
| Guyanese | 0.0 /100 | #334 | Tragic 24.8% |
| Arapaho | 0.0 /100 | #335 | Tragic 25.2% |
| Kiowa | 0.0 /100 | #336 | Tragic 25.2% |
| Immigrants | Guyana | 0.0 /100 | #337 | Tragic 25.5% |
| Immigrants | St. Vincent and the Grenadines | 0.0 /100 | #338 | Tragic 25.7% |
| Immigrants | Grenada | 0.0 /100 | #339 | Tragic 25.7% |
| Crow | 0.0 /100 | #340 | Tragic 26.2% |
| Puerto Ricans | 0.0 /100 | #341 | Tragic 27.5% |
| Inupiat | 0.0 /100 | #342 | Tragic 28.1% |
| Navajo | 0.0 /100 | #343 | Tragic 29.0% |
| Colville | 0.0 /100 | #344 | Tragic 29.7% |
| Hopi | 0.0 /100 | #345 | Tragic 30.7% |
| Yuman | 0.0 /100 | #346 | Tragic 37.4% |
| Yup'ik | 0.0 /100 | #347 | Tragic 41.0% |