Alaska Native vs Immigrants from Kazakhstan Unemployment Among Seniors over 75 years
COMPARE
Alaska Native
Immigrants from Kazakhstan
Unemployment Among Seniors over 75 years
Unemployment Among Seniors over 75 years Comparison
Alaska Natives
Immigrants from Kazakhstan
14.7%
UNEMPLOYMENT AMONG SENIORS OVER 75 YEARS
0.0/ 100
METRIC RATING
343rd/ 347
METRIC RANK
8.2%
UNEMPLOYMENT AMONG SENIORS OVER 75 YEARS
99.2/ 100
METRIC RATING
100th/ 347
METRIC RANK
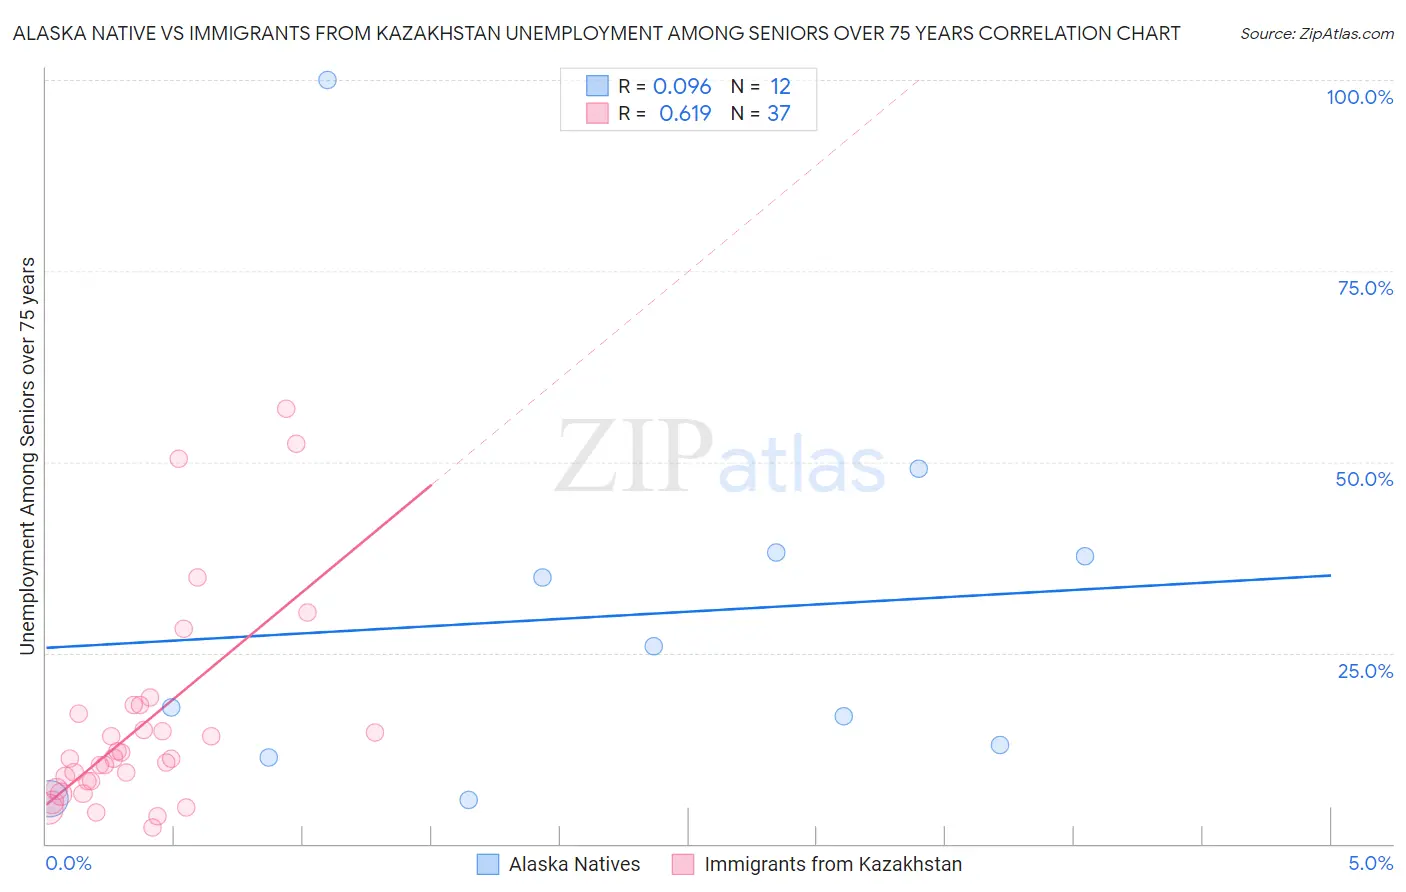
Alaska Native vs Immigrants from Kazakhstan Unemployment Among Seniors over 75 years Correlation Chart
The statistical analysis conducted on geographies consisting of 61,103,745 people shows a slight positive correlation between the proportion of Alaska Natives and unemployment rate among seniors over the age of 75 in the United States with a correlation coefficient (R) of 0.096 and weighted average of 14.7%. Similarly, the statistical analysis conducted on geographies consisting of 87,895,978 people shows a significant positive correlation between the proportion of Immigrants from Kazakhstan and unemployment rate among seniors over the age of 75 in the United States with a correlation coefficient (R) of 0.619 and weighted average of 8.2%, a difference of 79.3%.
Unemployment Among Seniors over 75 years Correlation Summary
| Measurement | Alaska Native | Immigrants from Kazakhstan |
| Minimum | 5.8% | 2.1% |
| Maximum | 100.0% | 56.9% |
| Range | 94.2% | 54.8% |
| Mean | 29.7% | 15.5% |
| Median | 21.8% | 11.2% |
| Interquartile 25% (IQ1) | 12.1% | 7.7% |
| Interquartile 75% (IQ3) | 37.9% | 17.5% |
| Interquartile Range (IQR) | 25.8% | 9.9% |
| Standard Deviation (Sample) | 26.2% | 13.4% |
| Standard Deviation (Population) | 25.1% | 13.2% |
Similar Demographics by Unemployment Among Seniors over 75 years
Demographics Similar to Alaska Natives by Unemployment Among Seniors over 75 years
In terms of unemployment among seniors over 75 years, the demographic groups most similar to Alaska Natives are Hmong (13.7%, a difference of 6.8%), Lumbee (13.5%, a difference of 8.9%), Immigrants from Yemen (16.5%, a difference of 12.4%), Yup'ik (12.8%, a difference of 14.9%), and Cajun (12.5%, a difference of 17.4%).
| Demographics | Rating | Rank | Unemployment Among Seniors over 75 years |
| Alaskan Athabascans | 0.0 /100 | #333 | Tragic 11.0% |
| Assyrians/Chaldeans/Syriacs | 0.0 /100 | #334 | Tragic 11.1% |
| French Canadians | 0.0 /100 | #335 | Tragic 11.2% |
| Immigrants | North Macedonia | 0.0 /100 | #336 | Tragic 11.3% |
| Cape Verdeans | 0.0 /100 | #337 | Tragic 11.4% |
| Immigrants | Cabo Verde | 0.0 /100 | #338 | Tragic 12.3% |
| Cajuns | 0.0 /100 | #339 | Tragic 12.5% |
| Yup'ik | 0.0 /100 | #340 | Tragic 12.8% |
| Lumbee | 0.0 /100 | #341 | Tragic 13.5% |
| Hmong | 0.0 /100 | #342 | Tragic 13.7% |
| Alaska Natives | 0.0 /100 | #343 | Tragic 14.7% |
| Immigrants | Yemen | 0.0 /100 | #344 | Tragic 16.5% |
| Yakama | 0.0 /100 | #345 | Tragic 18.4% |
| Tlingit-Haida | 0.0 /100 | #346 | Tragic 20.7% |
Demographics Similar to Immigrants from Kazakhstan by Unemployment Among Seniors over 75 years
In terms of unemployment among seniors over 75 years, the demographic groups most similar to Immigrants from Kazakhstan are Burmese (8.2%, a difference of 0.010%), Immigrants from Serbia (8.2%, a difference of 0.050%), Immigrants from Northern Africa (8.2%, a difference of 0.10%), Immigrants from Sri Lanka (8.2%, a difference of 0.14%), and Immigrants from Panama (8.2%, a difference of 0.14%).
| Demographics | Rating | Rank | Unemployment Among Seniors over 75 years |
| Immigrants | Netherlands | 99.5 /100 | #93 | Exceptional 8.1% |
| Immigrants | Ireland | 99.4 /100 | #94 | Exceptional 8.1% |
| Nicaraguans | 99.3 /100 | #95 | Exceptional 8.2% |
| Immigrants | Belgium | 99.3 /100 | #96 | Exceptional 8.2% |
| Immigrants | Sri Lanka | 99.3 /100 | #97 | Exceptional 8.2% |
| Immigrants | Northern Africa | 99.3 /100 | #98 | Exceptional 8.2% |
| Burmese | 99.2 /100 | #99 | Exceptional 8.2% |
| Immigrants | Kazakhstan | 99.2 /100 | #100 | Exceptional 8.2% |
| Immigrants | Serbia | 99.2 /100 | #101 | Exceptional 8.2% |
| Immigrants | Panama | 99.1 /100 | #102 | Exceptional 8.2% |
| South American Indians | 99.1 /100 | #103 | Exceptional 8.2% |
| Immigrants | South Central Asia | 99.0 /100 | #104 | Exceptional 8.2% |
| Immigrants | Caribbean | 99.0 /100 | #105 | Exceptional 8.2% |
| Immigrants | Honduras | 99.0 /100 | #106 | Exceptional 8.2% |
| Sri Lankans | 98.9 /100 | #107 | Exceptional 8.2% |