Alaska Native vs Aleut Unemployment Among Women with Children Under 18 years
COMPARE
Alaska Native
Aleut
Unemployment Among Women with Children Under 18 years
Unemployment Among Women with Children Under 18 years Comparison
Alaska Natives
Aleuts
6.7%
UNEMPLOYMENT AMONG WOMEN WITH CHILDREN UNDER 18 YEARS
0.0/ 100
METRIC RATING
318th/ 347
METRIC RANK
5.4%
UNEMPLOYMENT AMONG WOMEN WITH CHILDREN UNDER 18 YEARS
59.4/ 100
METRIC RATING
166th/ 347
METRIC RANK
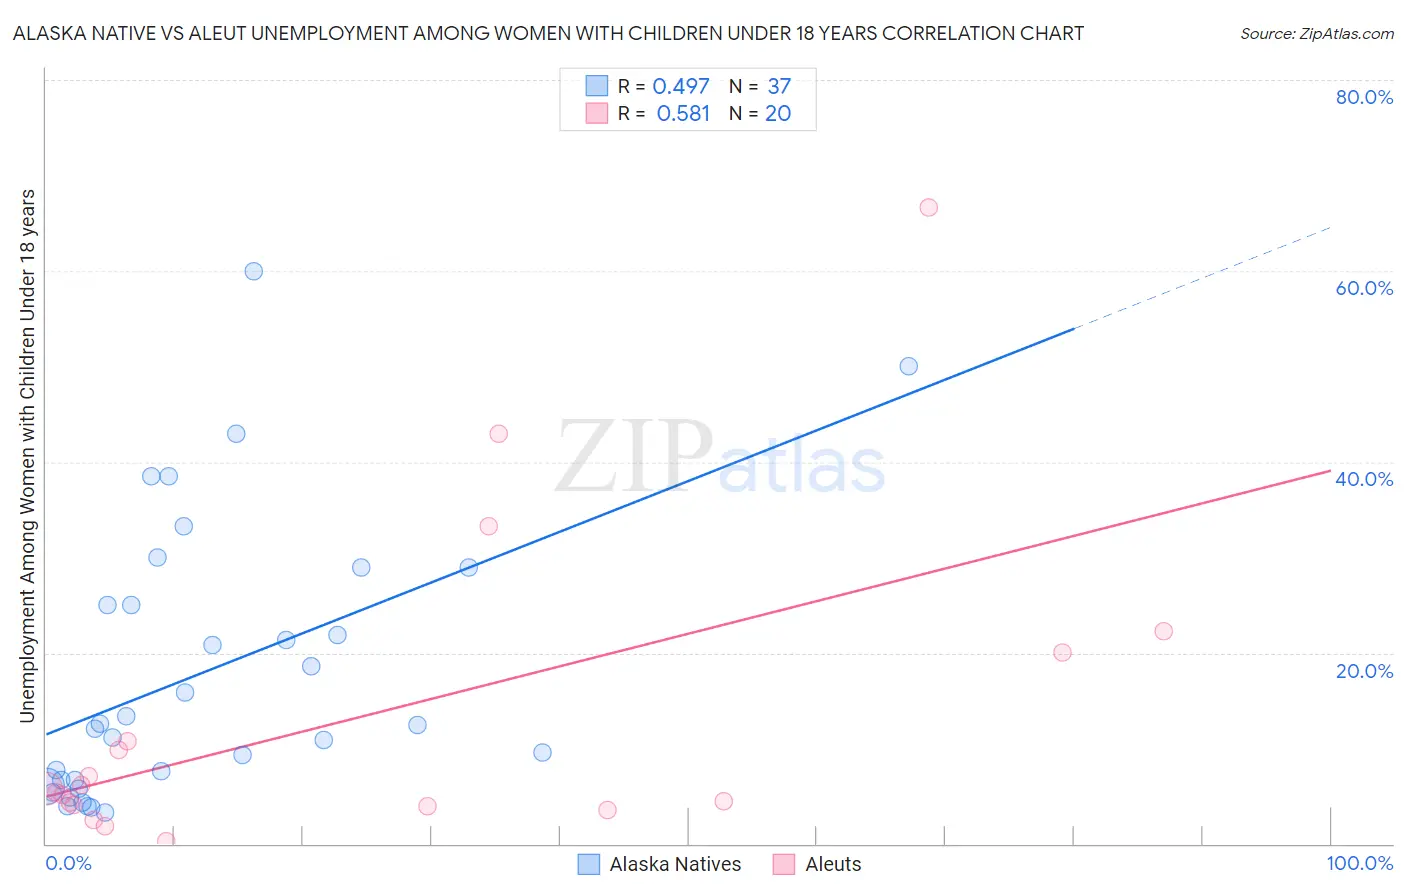
Alaska Native vs Aleut Unemployment Among Women with Children Under 18 years Correlation Chart
The statistical analysis conducted on geographies consisting of 75,718,891 people shows a moderate positive correlation between the proportion of Alaska Natives and unemployment rate among women with children under the age of 18 in the United States with a correlation coefficient (R) of 0.497 and weighted average of 6.7%. Similarly, the statistical analysis conducted on geographies consisting of 61,026,764 people shows a substantial positive correlation between the proportion of Aleuts and unemployment rate among women with children under the age of 18 in the United States with a correlation coefficient (R) of 0.581 and weighted average of 5.4%, a difference of 23.1%.
Unemployment Among Women with Children Under 18 years Correlation Summary
| Measurement | Alaska Native | Aleut |
| Minimum | 3.2% | 0.20% |
| Maximum | 60.0% | 66.7% |
| Range | 56.8% | 66.5% |
| Mean | 17.9% | 13.0% |
| Median | 12.5% | 5.6% |
| Interquartile 25% (IQ1) | 6.4% | 4.0% |
| Interquartile 75% (IQ3) | 27.0% | 15.4% |
| Interquartile Range (IQR) | 20.6% | 11.4% |
| Standard Deviation (Sample) | 14.4% | 16.8% |
| Standard Deviation (Population) | 14.2% | 16.4% |
Similar Demographics by Unemployment Among Women with Children Under 18 years
Demographics Similar to Alaska Natives by Unemployment Among Women with Children Under 18 years
In terms of unemployment among women with children under 18 years, the demographic groups most similar to Alaska Natives are Central American Indian (6.7%, a difference of 0.24%), Shoshone (6.6%, a difference of 0.29%), Immigrants from Ecuador (6.6%, a difference of 0.33%), Immigrants from Belize (6.7%, a difference of 0.33%), and U.S. Virgin Islander (6.7%, a difference of 0.39%).
| Demographics | Rating | Rank | Unemployment Among Women with Children Under 18 years |
| Yaqui | 0.0 /100 | #311 | Tragic 6.6% |
| Immigrants | Mexico | 0.0 /100 | #312 | Tragic 6.6% |
| Hispanics or Latinos | 0.0 /100 | #313 | Tragic 6.6% |
| British West Indians | 0.0 /100 | #314 | Tragic 6.6% |
| Immigrants | West Indies | 0.0 /100 | #315 | Tragic 6.6% |
| Immigrants | Ecuador | 0.0 /100 | #316 | Tragic 6.6% |
| Shoshone | 0.0 /100 | #317 | Tragic 6.6% |
| Alaska Natives | 0.0 /100 | #318 | Tragic 6.7% |
| Central American Indians | 0.0 /100 | #319 | Tragic 6.7% |
| Immigrants | Belize | 0.0 /100 | #320 | Tragic 6.7% |
| U.S. Virgin Islanders | 0.0 /100 | #321 | Tragic 6.7% |
| Houma | 0.0 /100 | #322 | Tragic 6.8% |
| Pueblo | 0.0 /100 | #323 | Tragic 6.8% |
| Paiute | 0.0 /100 | #324 | Tragic 6.9% |
| Immigrants | Dominica | 0.0 /100 | #325 | Tragic 7.0% |
Demographics Similar to Aleuts by Unemployment Among Women with Children Under 18 years
In terms of unemployment among women with children under 18 years, the demographic groups most similar to Aleuts are Immigrants from Denmark (5.4%, a difference of 0.10%), Tlingit-Haida (5.4%, a difference of 0.19%), Immigrants from Northern Africa (5.4%, a difference of 0.24%), Celtic (5.4%, a difference of 0.28%), and Immigrants from Thailand (5.4%, a difference of 0.30%).
| Demographics | Rating | Rank | Unemployment Among Women with Children Under 18 years |
| Chickasaw | 68.4 /100 | #159 | Good 5.4% |
| Afghans | 66.6 /100 | #160 | Good 5.4% |
| Immigrants | Iraq | 65.9 /100 | #161 | Good 5.4% |
| Immigrants | Saudi Arabia | 65.0 /100 | #162 | Good 5.4% |
| Lebanese | 64.7 /100 | #163 | Good 5.4% |
| Celtics | 63.0 /100 | #164 | Good 5.4% |
| Tlingit-Haida | 61.9 /100 | #165 | Good 5.4% |
| Aleuts | 59.4 /100 | #166 | Average 5.4% |
| Immigrants | Denmark | 58.0 /100 | #167 | Average 5.4% |
| Immigrants | Northern Africa | 56.1 /100 | #168 | Average 5.4% |
| Immigrants | Thailand | 55.3 /100 | #169 | Average 5.4% |
| Samoans | 54.1 /100 | #170 | Average 5.4% |
| Immigrants | Philippines | 53.1 /100 | #171 | Average 5.4% |
| Immigrants | Kazakhstan | 51.7 /100 | #172 | Average 5.4% |
| Immigrants | Eastern Africa | 51.3 /100 | #173 | Average 5.4% |