African vs Bangladeshi Unemployment Among Ages 30 to 34 years
COMPARE
African
Bangladeshi
Unemployment Among Ages 30 to 34 years
Unemployment Among Ages 30 to 34 years Comparison
Africans
Bangladeshis
6.4%
UNEMPLOYMENT AMONG AGES 30 TO 34 YEARS
0.0/ 100
METRIC RATING
282nd/ 347
METRIC RANK
5.3%
UNEMPLOYMENT AMONG AGES 30 TO 34 YEARS
76.6/ 100
METRIC RATING
134th/ 347
METRIC RANK
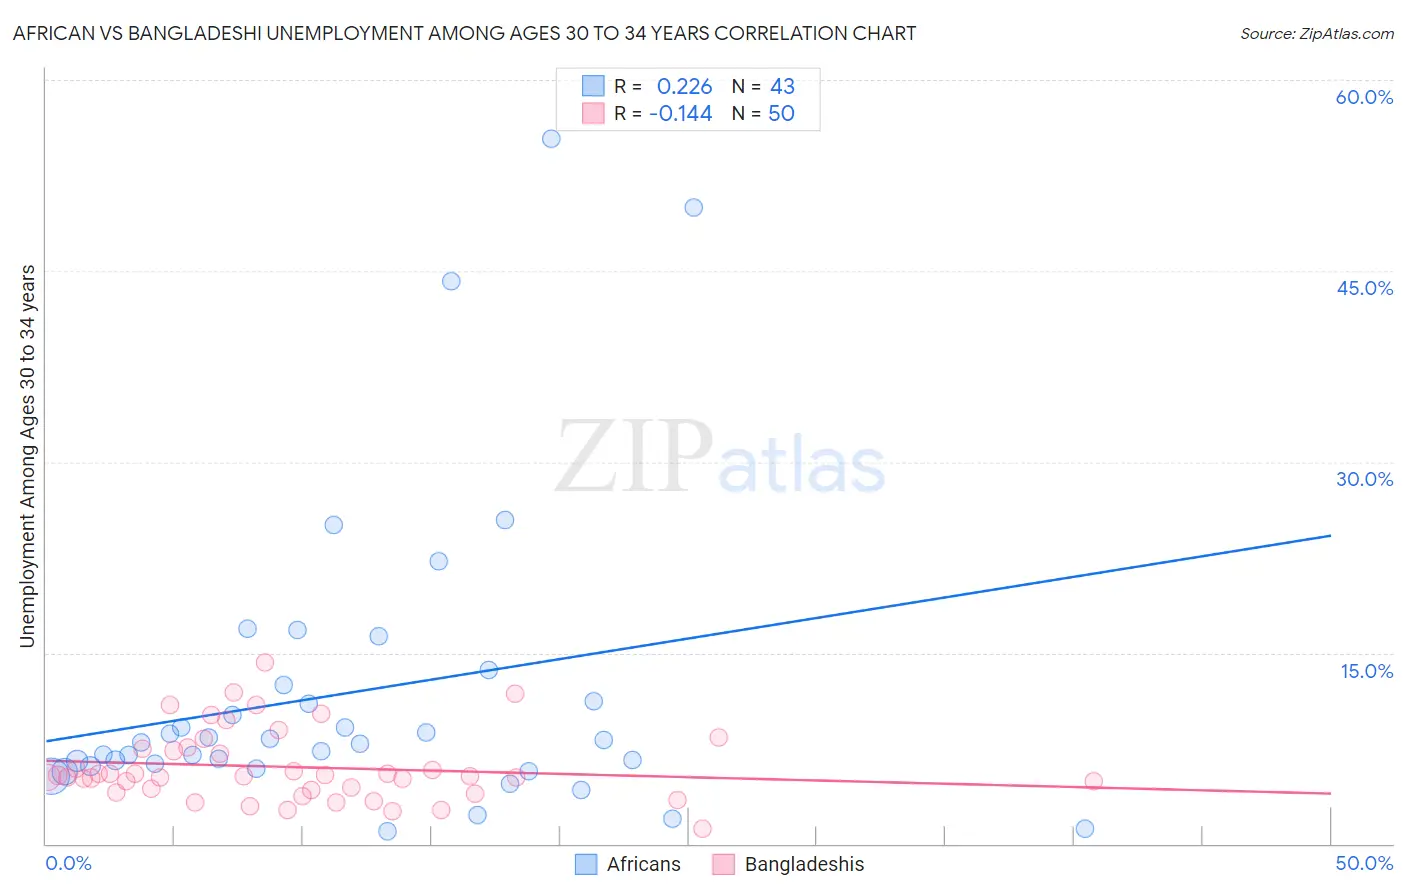
African vs Bangladeshi Unemployment Among Ages 30 to 34 years Correlation Chart
The statistical analysis conducted on geographies consisting of 439,187,267 people shows a weak positive correlation between the proportion of Africans and unemployment rate among population between the ages 30 and 34 in the United States with a correlation coefficient (R) of 0.226 and weighted average of 6.4%. Similarly, the statistical analysis conducted on geographies consisting of 137,750,600 people shows a poor negative correlation between the proportion of Bangladeshis and unemployment rate among population between the ages 30 and 34 in the United States with a correlation coefficient (R) of -0.144 and weighted average of 5.3%, a difference of 19.9%.
Unemployment Among Ages 30 to 34 years Correlation Summary
| Measurement | African | Bangladeshi |
| Minimum | 1.0% | 1.2% |
| Maximum | 55.4% | 14.2% |
| Range | 54.4% | 13.0% |
| Mean | 11.9% | 6.0% |
| Median | 7.9% | 5.3% |
| Interquartile 25% (IQ1) | 6.1% | 4.2% |
| Interquartile 75% (IQ3) | 12.4% | 7.4% |
| Interquartile Range (IQR) | 6.3% | 3.2% |
| Standard Deviation (Sample) | 11.9% | 2.8% |
| Standard Deviation (Population) | 11.8% | 2.8% |
Similar Demographics by Unemployment Among Ages 30 to 34 years
Demographics Similar to Africans by Unemployment Among Ages 30 to 34 years
In terms of unemployment among ages 30 to 34 years, the demographic groups most similar to Africans are Hispanic or Latino (6.4%, a difference of 0.030%), Immigrants from Bangladesh (6.4%, a difference of 0.090%), Choctaw (6.4%, a difference of 0.20%), Central American Indian (6.4%, a difference of 0.24%), and Immigrants from West Indies (6.4%, a difference of 0.26%).
| Demographics | Rating | Rank | Unemployment Among Ages 30 to 34 years |
| Ecuadorians | 0.0 /100 | #275 | Tragic 6.3% |
| Pennsylvania Germans | 0.0 /100 | #276 | Tragic 6.3% |
| Immigrants | Ecuador | 0.0 /100 | #277 | Tragic 6.3% |
| Osage | 0.0 /100 | #278 | Tragic 6.3% |
| Cree | 0.0 /100 | #279 | Tragic 6.4% |
| Cherokee | 0.0 /100 | #280 | Tragic 6.4% |
| Immigrants | Caribbean | 0.0 /100 | #281 | Tragic 6.4% |
| Africans | 0.0 /100 | #282 | Tragic 6.4% |
| Hispanics or Latinos | 0.0 /100 | #283 | Tragic 6.4% |
| Immigrants | Bangladesh | 0.0 /100 | #284 | Tragic 6.4% |
| Choctaw | 0.0 /100 | #285 | Tragic 6.4% |
| Central American Indians | 0.0 /100 | #286 | Tragic 6.4% |
| Immigrants | West Indies | 0.0 /100 | #287 | Tragic 6.4% |
| Senegalese | 0.0 /100 | #288 | Tragic 6.4% |
| Menominee | 0.0 /100 | #289 | Tragic 6.4% |
Demographics Similar to Bangladeshis by Unemployment Among Ages 30 to 34 years
In terms of unemployment among ages 30 to 34 years, the demographic groups most similar to Bangladeshis are Carpatho Rusyn (5.3%, a difference of 0.070%), Immigrants from Northern Europe (5.3%, a difference of 0.070%), Immigrants from Eastern Europe (5.3%, a difference of 0.080%), German (5.3%, a difference of 0.12%), and Palestinian (5.4%, a difference of 0.14%).
| Demographics | Rating | Rank | Unemployment Among Ages 30 to 34 years |
| Taiwanese | 79.4 /100 | #127 | Good 5.3% |
| Immigrants | Uruguay | 79.3 /100 | #128 | Good 5.3% |
| Poles | 78.8 /100 | #129 | Good 5.3% |
| Germans | 77.8 /100 | #130 | Good 5.3% |
| Immigrants | Eastern Europe | 77.4 /100 | #131 | Good 5.3% |
| Carpatho Rusyns | 77.3 /100 | #132 | Good 5.3% |
| Immigrants | Northern Europe | 77.3 /100 | #133 | Good 5.3% |
| Bangladeshis | 76.6 /100 | #134 | Good 5.3% |
| Palestinians | 75.1 /100 | #135 | Good 5.4% |
| Pakistanis | 74.6 /100 | #136 | Good 5.4% |
| Immigrants | Canada | 74.6 /100 | #137 | Good 5.4% |
| Serbians | 72.9 /100 | #138 | Good 5.4% |
| Lithuanians | 72.4 /100 | #139 | Good 5.4% |
| Immigrants | North America | 72.2 /100 | #140 | Good 5.4% |
| Immigrants | Europe | 72.1 /100 | #141 | Good 5.4% |