Afghan vs Yup'ik Unemployment Among Ages 20 to 24 years
COMPARE
Afghan
Yup'ik
Unemployment Among Ages 20 to 24 years
Unemployment Among Ages 20 to 24 years Comparison
Afghans
Yup'ik
9.6%
UNEMPLOYMENT AMONG AGES 20 TO 24 YEARS
99.9/ 100
METRIC RATING
38th/ 347
METRIC RANK
20.9%
UNEMPLOYMENT AMONG AGES 20 TO 24 YEARS
0.0/ 100
METRIC RATING
346th/ 347
METRIC RANK
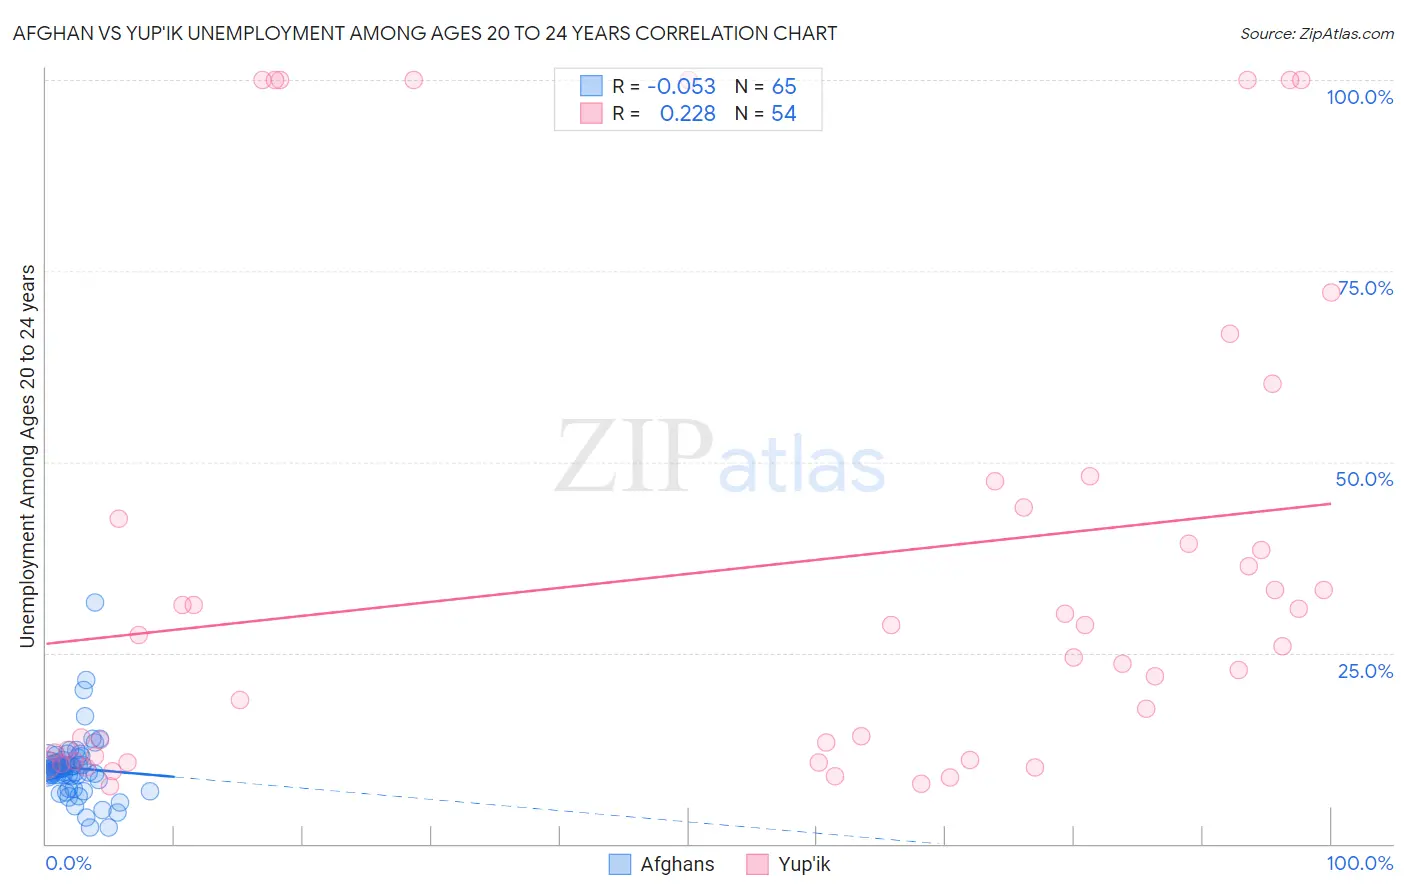
Afghan vs Yup'ik Unemployment Among Ages 20 to 24 years Correlation Chart
The statistical analysis conducted on geographies consisting of 147,858,089 people shows a slight negative correlation between the proportion of Afghans and unemployment rate among population between the ages 20 and 24 in the United States with a correlation coefficient (R) of -0.053 and weighted average of 9.6%. Similarly, the statistical analysis conducted on geographies consisting of 39,683,976 people shows a weak positive correlation between the proportion of Yup'ik and unemployment rate among population between the ages 20 and 24 in the United States with a correlation coefficient (R) of 0.228 and weighted average of 20.9%, a difference of 117.4%.
Unemployment Among Ages 20 to 24 years Correlation Summary
| Measurement | Afghan | Yup'ik |
| Minimum | 2.1% | 7.5% |
| Maximum | 31.6% | 100.0% |
| Range | 29.5% | 92.5% |
| Mean | 9.9% | 36.0% |
| Median | 9.7% | 26.6% |
| Interquartile 25% (IQ1) | 8.6% | 11.4% |
| Interquartile 75% (IQ3) | 10.7% | 44.0% |
| Interquartile Range (IQR) | 2.1% | 32.6% |
| Standard Deviation (Sample) | 4.3% | 30.8% |
| Standard Deviation (Population) | 4.3% | 30.6% |
Similar Demographics by Unemployment Among Ages 20 to 24 years
Demographics Similar to Afghans by Unemployment Among Ages 20 to 24 years
In terms of unemployment among ages 20 to 24 years, the demographic groups most similar to Afghans are Immigrants from Zaire (9.6%, a difference of 0.070%), Belgian (9.6%, a difference of 0.15%), German (9.6%, a difference of 0.18%), Dutch (9.6%, a difference of 0.22%), and Yugoslavian (9.6%, a difference of 0.25%).
| Demographics | Rating | Rank | Unemployment Among Ages 20 to 24 years |
| Immigrants | Eastern Africa | 100.0 /100 | #31 | Exceptional 9.5% |
| Cambodians | 100.0 /100 | #32 | Exceptional 9.5% |
| Australians | 100.0 /100 | #33 | Exceptional 9.6% |
| Yugoslavians | 100.0 /100 | #34 | Exceptional 9.6% |
| Germans | 100.0 /100 | #35 | Exceptional 9.6% |
| Belgians | 100.0 /100 | #36 | Exceptional 9.6% |
| Immigrants | Zaire | 100.0 /100 | #37 | Exceptional 9.6% |
| Afghans | 99.9 /100 | #38 | Exceptional 9.6% |
| Dutch | 99.9 /100 | #39 | Exceptional 9.6% |
| Immigrants | Ethiopia | 99.9 /100 | #40 | Exceptional 9.6% |
| Swiss | 99.9 /100 | #41 | Exceptional 9.7% |
| Immigrants | Saudi Arabia | 99.9 /100 | #42 | Exceptional 9.7% |
| Menominee | 99.8 /100 | #43 | Exceptional 9.7% |
| Europeans | 99.8 /100 | #44 | Exceptional 9.7% |
| Croatians | 99.8 /100 | #45 | Exceptional 9.7% |
Demographics Similar to Yup'ik by Unemployment Among Ages 20 to 24 years
In terms of unemployment among ages 20 to 24 years, the demographic groups most similar to Yup'ik are Inupiat (20.9%, a difference of 0.27%), Hopi (19.9%, a difference of 4.9%), Crow (18.7%, a difference of 11.4%), Tsimshian (18.0%, a difference of 16.0%), and Puerto Rican (16.7%, a difference of 25.3%).
| Demographics | Rating | Rank | Unemployment Among Ages 20 to 24 years |
| Immigrants | Guyana | 0.0 /100 | #333 | Tragic 13.9% |
| Guyanese | 0.0 /100 | #334 | Tragic 14.0% |
| Sioux | 0.0 /100 | #335 | Tragic 14.2% |
| Pima | 0.0 /100 | #336 | Tragic 14.2% |
| Paiute | 0.0 /100 | #337 | Tragic 14.3% |
| Immigrants | St. Vincent and the Grenadines | 0.0 /100 | #338 | Tragic 14.3% |
| Immigrants | Yemen | 0.0 /100 | #339 | Tragic 14.9% |
| Yuman | 0.0 /100 | #340 | Tragic 15.8% |
| Navajo | 0.0 /100 | #341 | Tragic 16.1% |
| Puerto Ricans | 0.0 /100 | #342 | Tragic 16.7% |
| Tsimshian | 0.0 /100 | #343 | Tragic 18.0% |
| Crow | 0.0 /100 | #344 | Tragic 18.7% |
| Hopi | 0.0 /100 | #345 | Tragic 19.9% |
| Yup'ik | 0.0 /100 | #346 | Tragic 20.9% |
| Inupiat | 0.0 /100 | #347 | Tragic 20.9% |