Afghan vs Immigrants from Greece Female Unemployment
COMPARE
Afghan
Immigrants from Greece
Female Unemployment
Female Unemployment Comparison
Afghans
Immigrants from Greece
5.3%
FEMALE UNEMPLOYMENT
33.9/ 100
METRIC RATING
188th/ 347
METRIC RANK
5.2%
FEMALE UNEMPLOYMENT
74.9/ 100
METRIC RATING
153rd/ 347
METRIC RANK
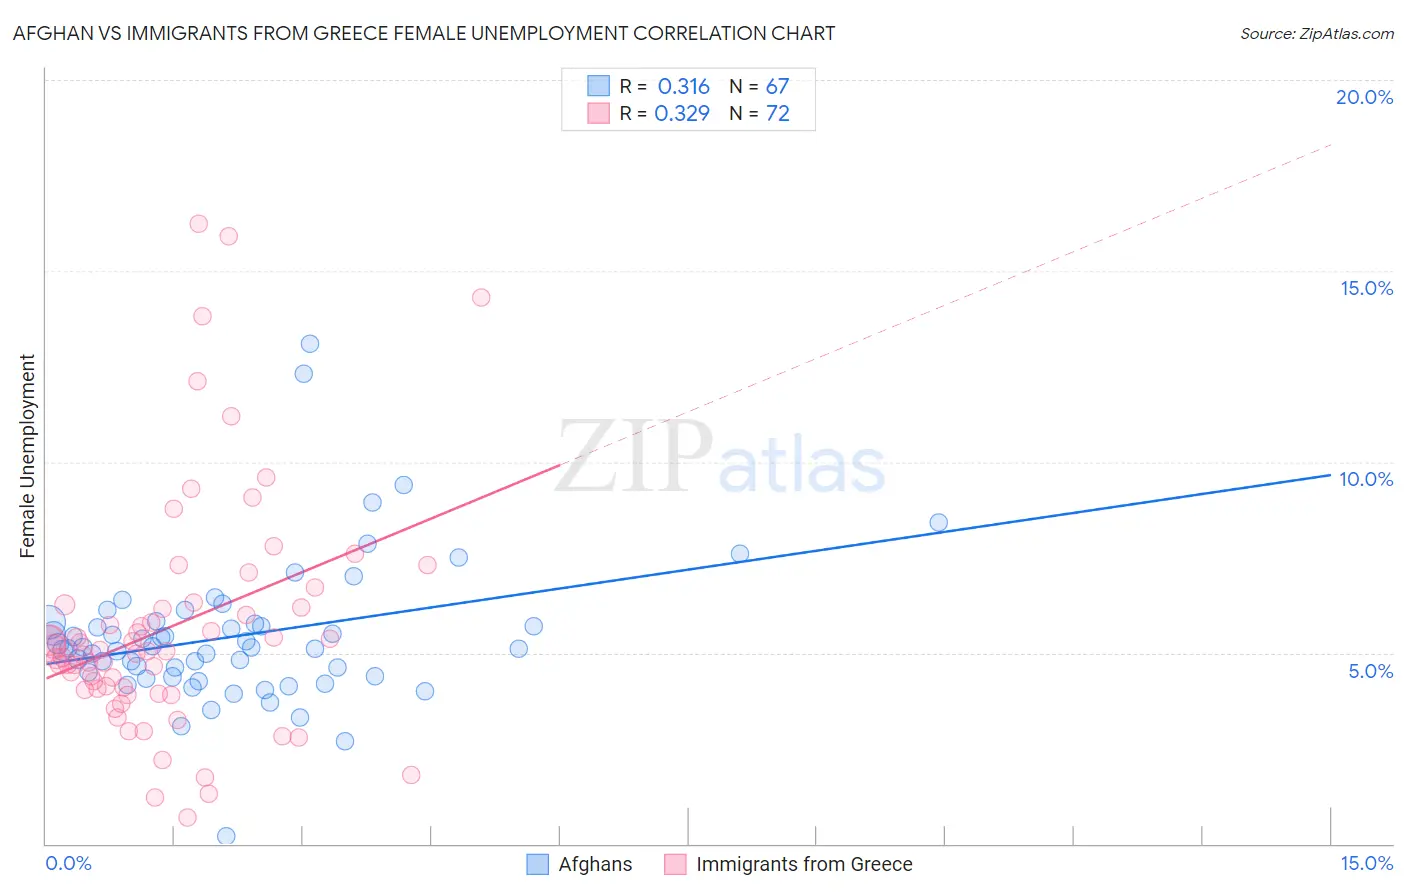
Afghan vs Immigrants from Greece Female Unemployment Correlation Chart
The statistical analysis conducted on geographies consisting of 148,787,124 people shows a mild positive correlation between the proportion of Afghans and unemploymnet rate among females in the United States with a correlation coefficient (R) of 0.316 and weighted average of 5.3%. Similarly, the statistical analysis conducted on geographies consisting of 216,457,402 people shows a mild positive correlation between the proportion of Immigrants from Greece and unemploymnet rate among females in the United States with a correlation coefficient (R) of 0.329 and weighted average of 5.2%, a difference of 2.7%.
Female Unemployment Correlation Summary
| Measurement | Afghan | Immigrants from Greece |
| Minimum | 0.20% | 0.70% |
| Maximum | 13.1% | 16.2% |
| Range | 12.9% | 15.5% |
| Mean | 5.4% | 5.7% |
| Median | 5.1% | 5.0% |
| Interquartile 25% (IQ1) | 4.4% | 4.0% |
| Interquartile 75% (IQ3) | 5.8% | 6.2% |
| Interquartile Range (IQR) | 1.4% | 2.2% |
| Standard Deviation (Sample) | 1.9% | 3.1% |
| Standard Deviation (Population) | 1.9% | 3.1% |
Similar Demographics by Female Unemployment
Demographics Similar to Afghans by Female Unemployment
In terms of female unemployment, the demographic groups most similar to Afghans are Costa Rican (5.3%, a difference of 0.0%), Immigrants from Albania (5.3%, a difference of 0.10%), Ugandan (5.3%, a difference of 0.18%), Cherokee (5.3%, a difference of 0.21%), and Immigrants from Belarus (5.3%, a difference of 0.35%).
| Demographics | Rating | Rank | Female Unemployment |
| Taiwanese | 42.7 /100 | #181 | Average 5.3% |
| Immigrants | Nonimmigrants | 42.6 /100 | #182 | Average 5.3% |
| Immigrants | Indonesia | 40.7 /100 | #183 | Average 5.3% |
| Immigrants | Ukraine | 40.1 /100 | #184 | Average 5.3% |
| Malaysians | 40.1 /100 | #185 | Average 5.3% |
| Immigrants | Belarus | 39.4 /100 | #186 | Fair 5.3% |
| Immigrants | Albania | 35.4 /100 | #187 | Fair 5.3% |
| Afghans | 33.9 /100 | #188 | Fair 5.3% |
| Costa Ricans | 33.8 /100 | #189 | Fair 5.3% |
| Ugandans | 31.2 /100 | #190 | Fair 5.3% |
| Cherokee | 30.8 /100 | #191 | Fair 5.3% |
| Portuguese | 28.6 /100 | #192 | Fair 5.3% |
| Arabs | 27.7 /100 | #193 | Fair 5.3% |
| Colombians | 27.0 /100 | #194 | Fair 5.3% |
| Immigrants | Colombia | 26.2 /100 | #195 | Fair 5.3% |
Demographics Similar to Immigrants from Greece by Female Unemployment
In terms of female unemployment, the demographic groups most similar to Immigrants from Greece are Immigrants from Italy (5.2%, a difference of 0.010%), Immigrants from China (5.2%, a difference of 0.080%), Egyptian (5.2%, a difference of 0.29%), Asian (5.2%, a difference of 0.30%), and South African (5.2%, a difference of 0.32%).
| Demographics | Rating | Rank | Female Unemployment |
| Immigrants | Norway | 79.4 /100 | #146 | Good 5.2% |
| Argentineans | 79.2 /100 | #147 | Good 5.2% |
| Immigrants | Argentina | 78.7 /100 | #148 | Good 5.2% |
| Asians | 78.3 /100 | #149 | Good 5.2% |
| Egyptians | 78.3 /100 | #150 | Good 5.2% |
| Immigrants | China | 75.9 /100 | #151 | Good 5.2% |
| Immigrants | Italy | 75.0 /100 | #152 | Good 5.2% |
| Immigrants | Greece | 74.9 /100 | #153 | Good 5.2% |
| South Africans | 70.8 /100 | #154 | Good 5.2% |
| Immigrants | Egypt | 70.0 /100 | #155 | Good 5.2% |
| Immigrants | Northern Africa | 69.6 /100 | #156 | Good 5.2% |
| Immigrants | Russia | 69.3 /100 | #157 | Good 5.2% |
| Albanians | 68.3 /100 | #158 | Good 5.2% |
| Immigrants | Micronesia | 66.9 /100 | #159 | Good 5.2% |
| Immigrants | Spain | 66.8 /100 | #160 | Good 5.2% |