Zip Codes with the Highest Percentage of Population with a Degree in Physical and Health Sciences in North Richland Hills, TX
RELATED REPORTS & OPTIONS
Physical and Health Sciences
North Richland Hills
Compare Zip Codes
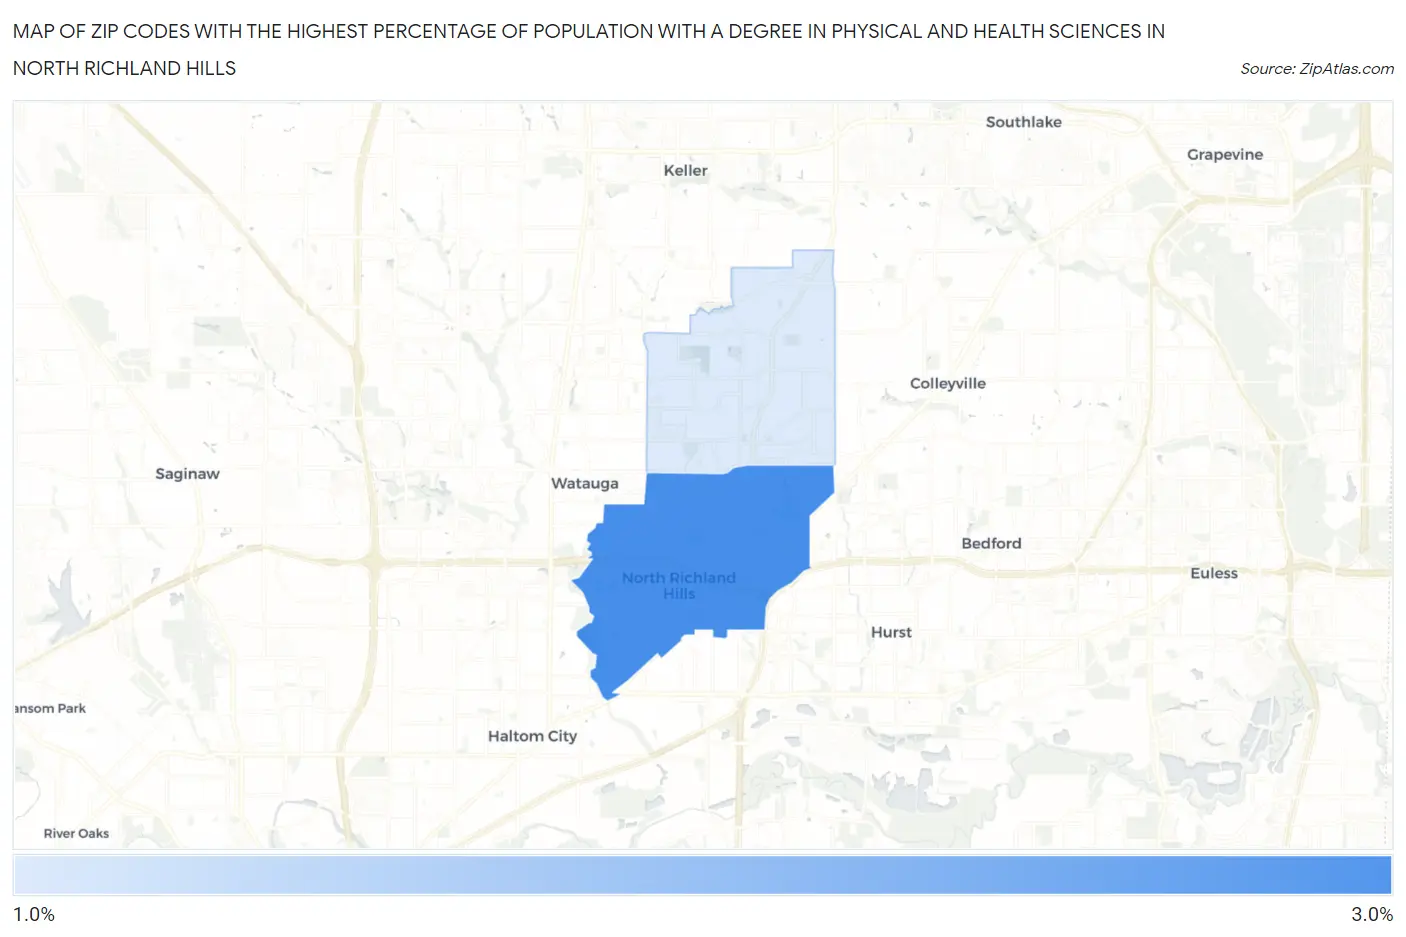
Map of Zip Codes with the Highest Percentage of Population with a Degree in Physical and Health Sciences in North Richland Hills
2.0%
2.8%
Zip Codes with the Highest Percentage of Population with a Degree in Physical and Health Sciences in North Richland Hills, TX
| Zip Code | % Graduates | vs State | vs National | |
| 1. | 76180 | 2.8% | 3.3%(-0.567)#746 | 3.1%(-0.347)#11,540 |
| 2. | 76182 | 2.0% | 3.3%(-1.33)#966 | 3.1%(-1.11)#15,159 |
1
Common Questions
What are the Top Zip Codes with the Highest Percentage of Population with a Degree in Physical and Health Sciences in North Richland Hills, TX?
Top Zip Codes with the Highest Percentage of Population with a Degree in Physical and Health Sciences in North Richland Hills, TX are:
What zip code has the Highest Percentage of Population with a Degree in Physical and Health Sciences in North Richland Hills, TX?
76180 has the Highest Percentage of Population with a Degree in Physical and Health Sciences in North Richland Hills, TX with 2.8%.
What is the Percentage of Population with a Degree in Physical and Health Sciences in North Richland Hills, TX?
Percentage of Population with a Degree in Physical and Health Sciences in North Richland Hills is 2.4%.
What is the Percentage of Population with a Degree in Physical and Health Sciences in Texas?
Percentage of Population with a Degree in Physical and Health Sciences in Texas is 3.3%.
What is the Percentage of Population with a Degree in Physical and Health Sciences in the United States?
Percentage of Population with a Degree in Physical and Health Sciences in the United States is 3.1%.