Zip Codes with the Highest Percentage of Population Employed in Agriculture, Fishing & Hunting in Harlingen, TX
RELATED REPORTS & OPTIONS
Agriculture, Fishing & Hunting
Harlingen
Compare Zip Codes
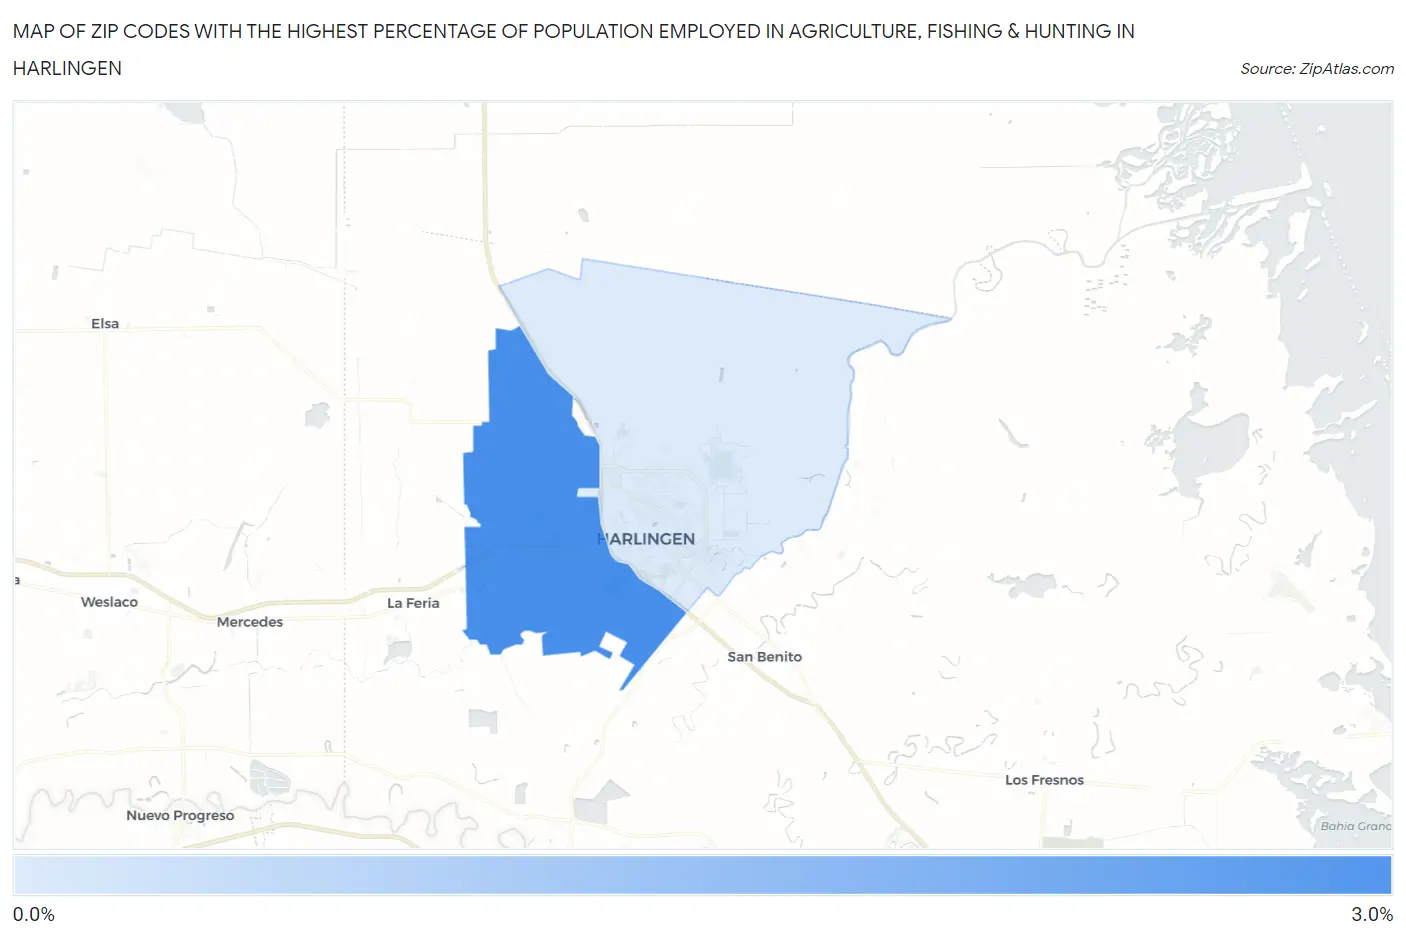
Map of Zip Codes with the Highest Percentage of Population Employed in Agriculture, Fishing & Hunting in Harlingen
0.0%
3.0%
Zip Codes with the Highest Percentage of Population Employed in Agriculture, Fishing & Hunting in Harlingen, TX
| Zip Code | % Employed | vs State | vs National | |
| 1. | 78552 | 2.6% | 0.75%(+1.87)#590 | 1.2%(+1.42)#11,309 |
| 2. | 78550 | 0.33% | 0.75%(-0.418)#1,137 | 1.2%(-0.866)#20,821 |
1
Common Questions
What are the Top Zip Codes with the Highest Percentage of Population Employed in Agriculture, Fishing & Hunting in Harlingen, TX?
Top Zip Codes with the Highest Percentage of Population Employed in Agriculture, Fishing & Hunting in Harlingen, TX are:
What zip code has the Highest Percentage of Population Employed in Agriculture, Fishing & Hunting in Harlingen, TX?
78552 has the Highest Percentage of Population Employed in Agriculture, Fishing & Hunting in Harlingen, TX with 2.6%.
What is the Percentage of Population Employed in Agriculture, Fishing & Hunting in Harlingen, TX?
Percentage of Population Employed in Agriculture, Fishing & Hunting in Harlingen is 0.72%.
What is the Percentage of Population Employed in Agriculture, Fishing & Hunting in Texas?
Percentage of Population Employed in Agriculture, Fishing & Hunting in Texas is 0.75%.
What is the Percentage of Population Employed in Agriculture, Fishing & Hunting in the United States?
Percentage of Population Employed in Agriculture, Fishing & Hunting in the United States is 1.2%.