Zip Codes with the Highest Percentage of Population Employed in Sales & Related in Brownsville, TX
RELATED REPORTS & OPTIONS
Sales & Related
Brownsville
Compare Zip Codes
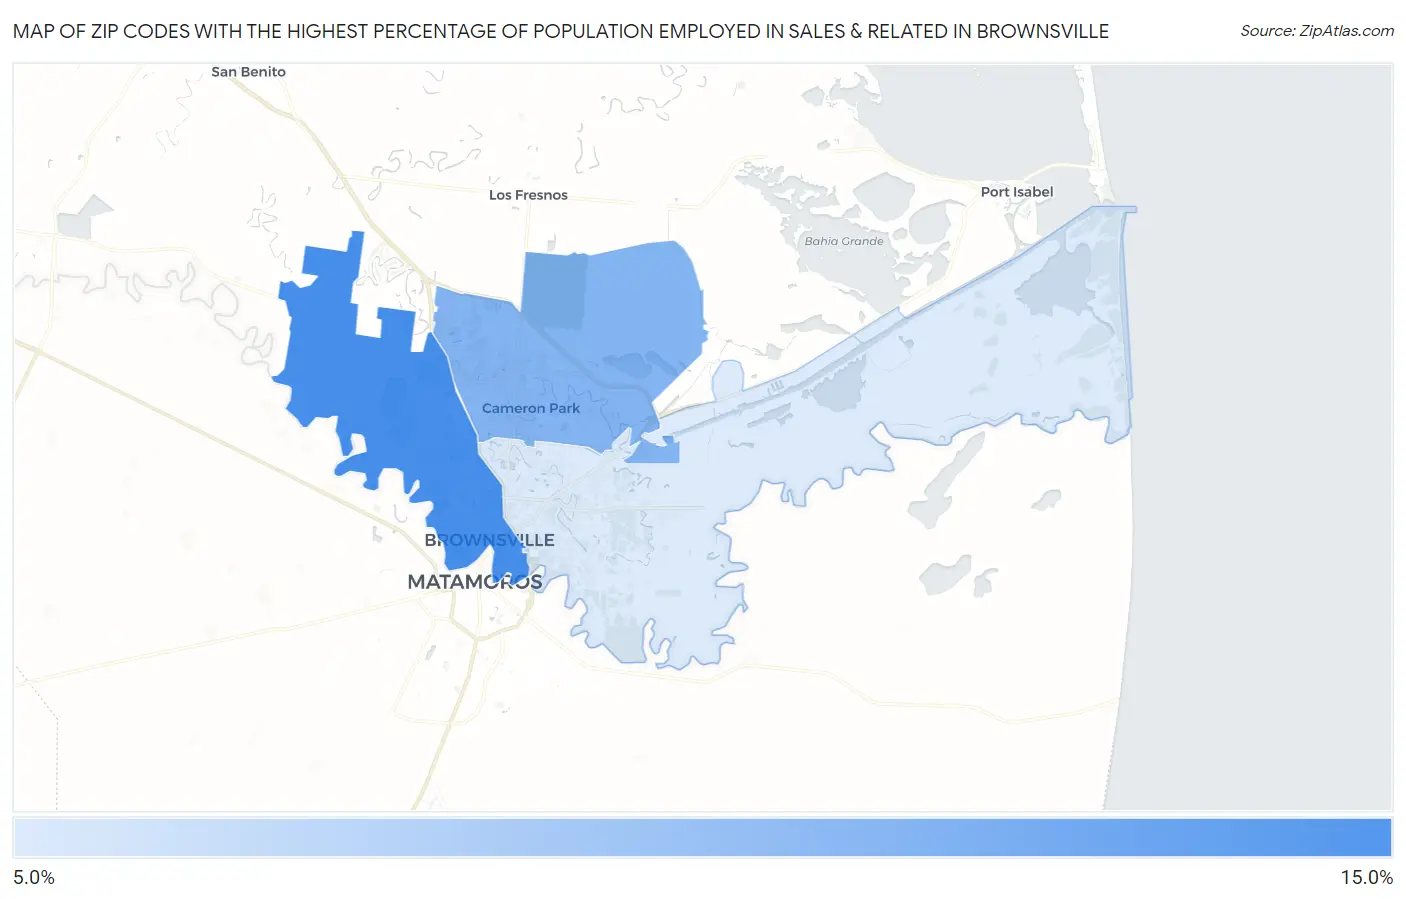
Map of Zip Codes with the Highest Percentage of Population Employed in Sales & Related in Brownsville
0.0%
15.0%
Zip Codes with the Highest Percentage of Population Employed in Sales & Related in Brownsville, TX
| Zip Code | % Employed | vs State | vs National | |
| 1. | 78520 | 12.5% | 10.2%(+2.24)#367 | 9.6%(+2.87)#5,234 |
| 2. | 78526 | 11.1% | 10.2%(+0.874)#576 | 9.6%(+1.50)#7,963 |
| 3. | 78521 | 9.1% | 10.2%(-1.16)#1,001 | 9.6%(-0.528)#14,275 |
1
Common Questions
What are the Top Zip Codes with the Highest Percentage of Population Employed in Sales & Related in Brownsville, TX?
Top Zip Codes with the Highest Percentage of Population Employed in Sales & Related in Brownsville, TX are:
What zip code has the Highest Percentage of Population Employed in Sales & Related in Brownsville, TX?
78520 has the Highest Percentage of Population Employed in Sales & Related in Brownsville, TX with 12.5%.
What is the Percentage of Population Employed in Sales & Related in Brownsville, TX?
Percentage of Population Employed in Sales & Related in Brownsville is 10.9%.
What is the Percentage of Population Employed in Sales & Related in Texas?
Percentage of Population Employed in Sales & Related in Texas is 10.2%.
What is the Percentage of Population Employed in Sales & Related in the United States?
Percentage of Population Employed in Sales & Related in the United States is 9.6%.