Zip Codes with the Highest Percentage of Population Employed in Agriculture, Fishing & Hunting in Seneca, SC
RELATED REPORTS & OPTIONS
Select to Compare
Select to Compare
Compare Zip Codes
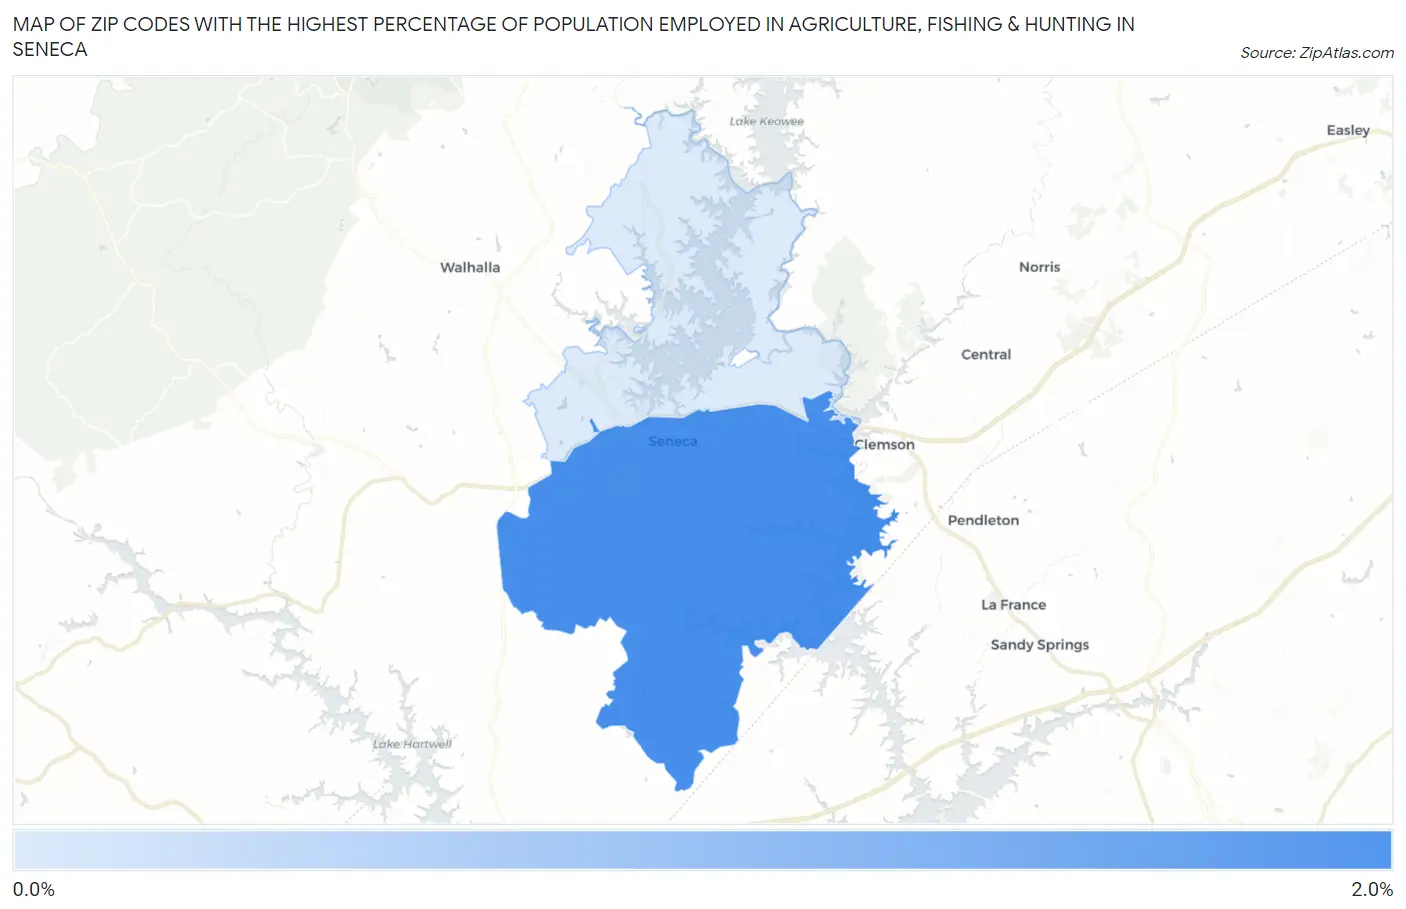
Map of Zip Codes with the Highest Percentage of Population Employed in Agriculture, Fishing & Hunting in Seneca
0.0%
2.0%
Zip Codes with the Highest Percentage of Population Employed in Agriculture, Fishing & Hunting in Seneca, SC
| Zip Code | % Employed | vs State | vs National | |
| 1. | 29678 | 1.6% | 0.78%(+0.786)#124 | 1.2%(+0.364)#14,078 |
1
Common Questions
What are the Top Zip Codes with the Highest Percentage of Population Employed in Agriculture, Fishing & Hunting in Seneca, SC?
Top Zip Codes with the Highest Percentage of Population Employed in Agriculture, Fishing & Hunting in Seneca, SC are:
What zip code has the Highest Percentage of Population Employed in Agriculture, Fishing & Hunting in Seneca, SC?
29678 has the Highest Percentage of Population Employed in Agriculture, Fishing & Hunting in Seneca, SC with 1.6%.
What is the Percentage of Population Employed in Agriculture, Fishing & Hunting in Seneca, SC?
Percentage of Population Employed in Agriculture, Fishing & Hunting in Seneca is 3.8%.
What is the Percentage of Population Employed in Agriculture, Fishing & Hunting in South Carolina?
Percentage of Population Employed in Agriculture, Fishing & Hunting in South Carolina is 0.78%.
What is the Percentage of Population Employed in Agriculture, Fishing & Hunting in the United States?
Percentage of Population Employed in Agriculture, Fishing & Hunting in the United States is 1.2%.