Zip Codes with the Highest Percentage of Population Employed in Agriculture, Fishing & Hunting in Rock Hill, SC
RELATED REPORTS & OPTIONS
Agriculture, Fishing & Hunting
Rock Hill
Compare Zip Codes
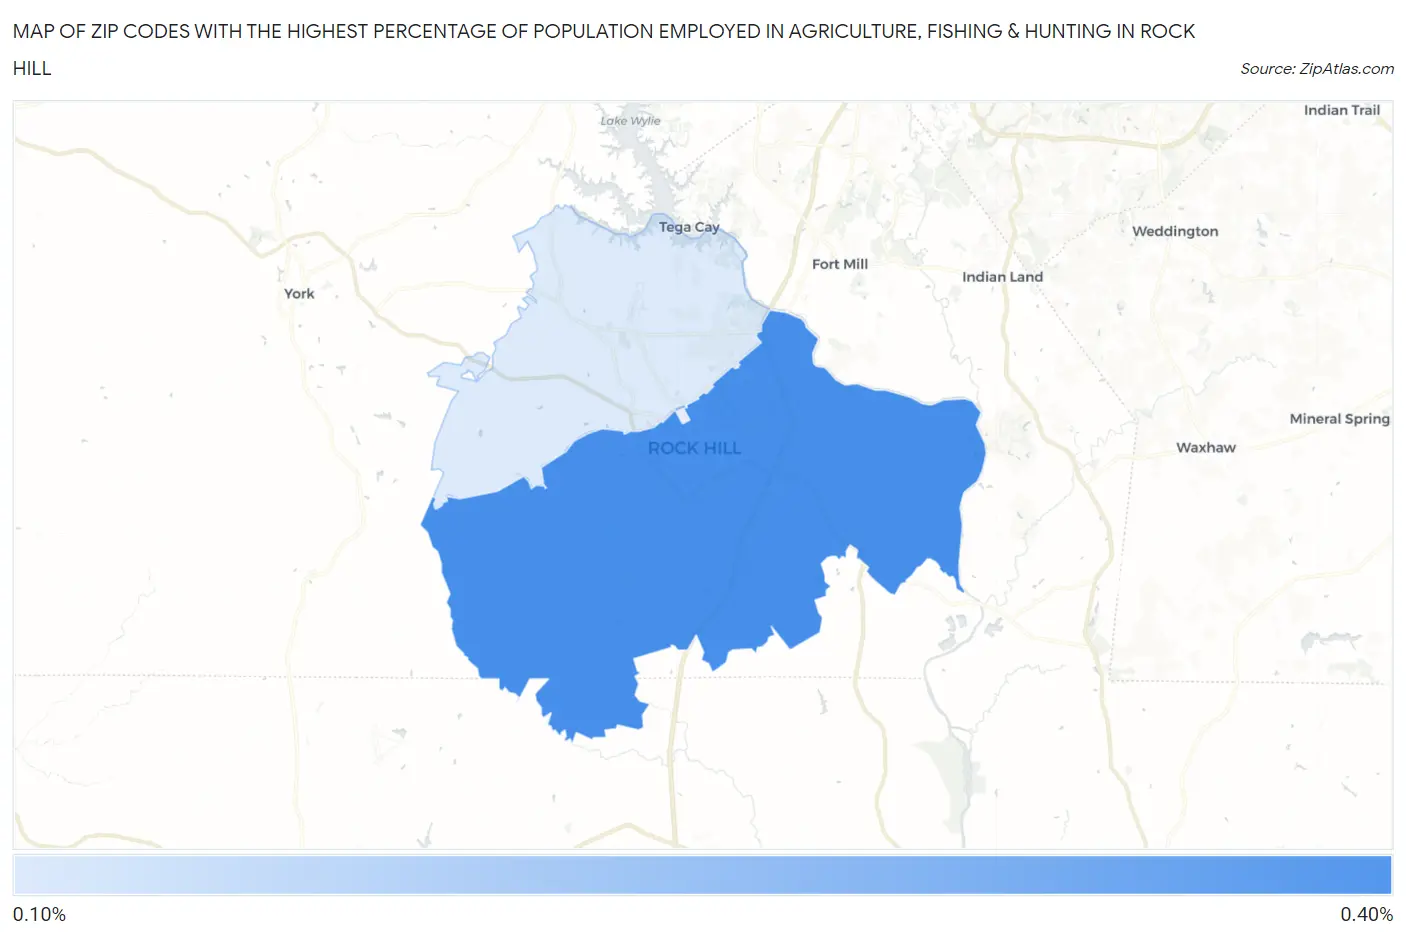
Map of Zip Codes with the Highest Percentage of Population Employed in Agriculture, Fishing & Hunting in Rock Hill
0.15%
0.37%
Zip Codes with the Highest Percentage of Population Employed in Agriculture, Fishing & Hunting in Rock Hill, SC
| Zip Code | % Employed | vs State | vs National | |
| 1. | 29730 | 0.37% | 0.78%(-0.407)#244 | 1.2%(-0.828)#20,422 |
| 2. | 29732 | 0.15% | 0.78%(-0.626)#281 | 1.2%(-1.05)#22,980 |
1
Common Questions
What are the Top Zip Codes with the Highest Percentage of Population Employed in Agriculture, Fishing & Hunting in Rock Hill, SC?
Top Zip Codes with the Highest Percentage of Population Employed in Agriculture, Fishing & Hunting in Rock Hill, SC are:
What zip code has the Highest Percentage of Population Employed in Agriculture, Fishing & Hunting in Rock Hill, SC?
29730 has the Highest Percentage of Population Employed in Agriculture, Fishing & Hunting in Rock Hill, SC with 0.37%.
What is the Percentage of Population Employed in Agriculture, Fishing & Hunting in Rock Hill, SC?
Percentage of Population Employed in Agriculture, Fishing & Hunting in Rock Hill is 0.31%.
What is the Percentage of Population Employed in Agriculture, Fishing & Hunting in South Carolina?
Percentage of Population Employed in Agriculture, Fishing & Hunting in South Carolina is 0.78%.
What is the Percentage of Population Employed in Agriculture, Fishing & Hunting in the United States?
Percentage of Population Employed in Agriculture, Fishing & Hunting in the United States is 1.2%.