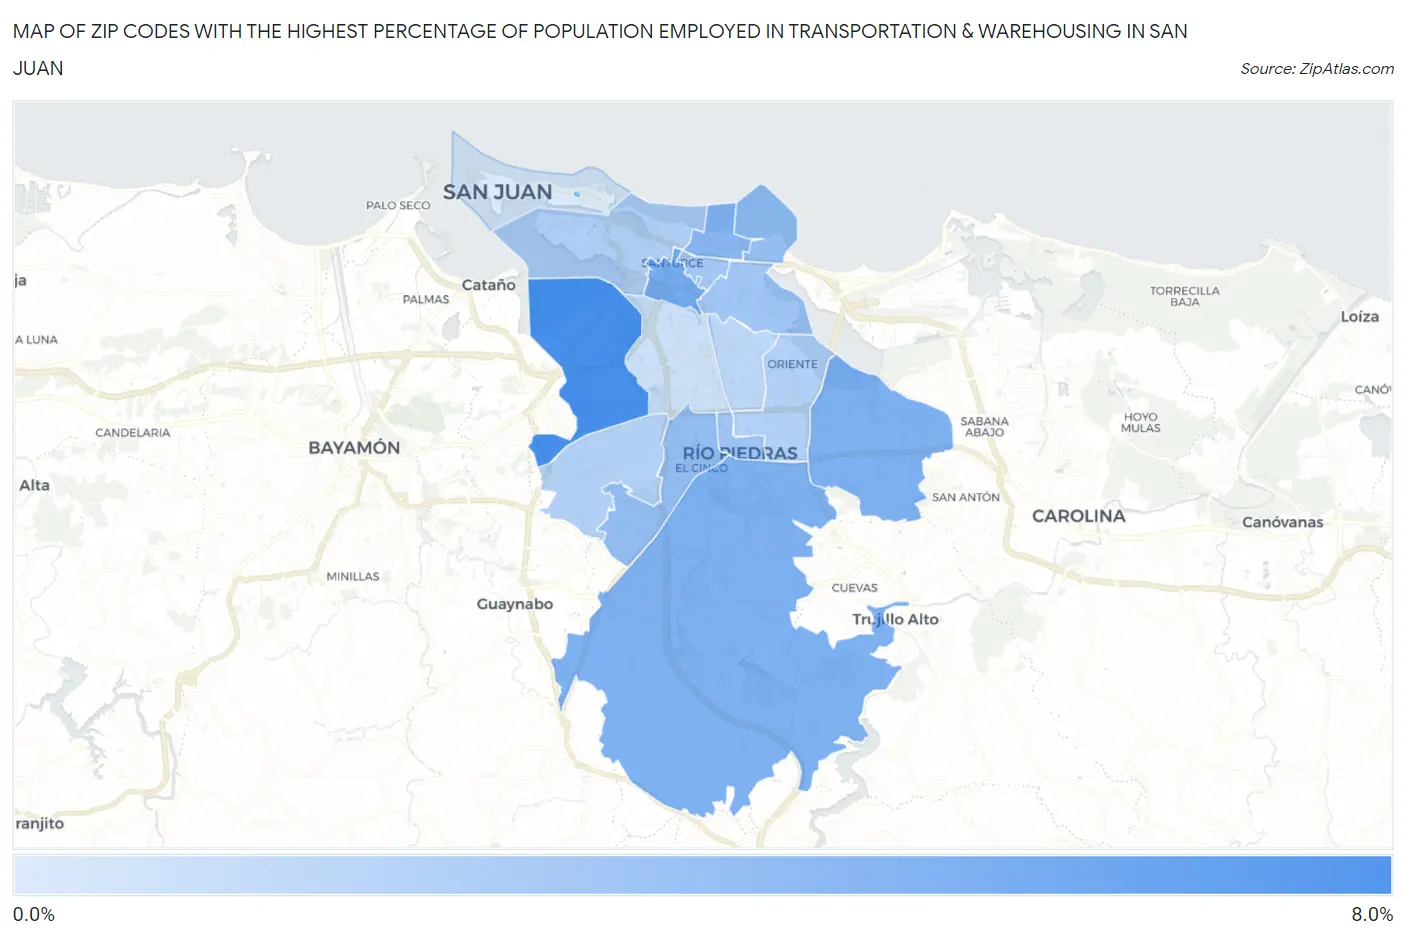
Zip Codes with the Highest Percentage of Population Employed in Transportation & Warehousing in San Juan, PR
RELATED REPORTS & OPTIONS
Transportation & Warehousing
San Juan
Compare Zip Codes
Map of Zip Codes with the Highest Percentage of Population Employed in Transportation & Warehousing in San Juan
0.0%
8.0%
Zip Codes with the Highest Percentage of Population Employed in Transportation & Warehousing in San Juan, PR
| Zip Code | % Employed | vs State | vs National | |
| 1. | 00920 | 6.4% | 2.9%(+3.54)#5 | 4.9%(+1.50)#7,679 |
| 2. | 00909 | 4.6% | 2.9%(+1.68)#16 | 4.9%(-0.355)#13,439 |
| 3. | 00924 | 4.2% | 2.9%(+1.31)#19 | 4.9%(-0.729)#14,952 |
| 4. | 00926 | 4.2% | 2.9%(+1.25)#20 | 4.9%(-0.783)#15,187 |
| 5. | 00911 | 3.8% | 2.9%(+0.936)#23 | 4.9%(-1.10)#16,600 |
| 6. | 00927 | 3.3% | 2.9%(+0.431)#40 | 4.9%(-1.61)#18,752 |
| 7. | 00913 | 3.2% | 2.9%(+0.327)#42 | 4.9%(-1.71)#19,198 |
| 8. | 00925 | 2.9% | 2.9%(-0.047)#54 | 4.9%(-2.08)#20,847 |
| 9. | 00915 | 2.8% | 2.9%(-0.066)#55 | 4.9%(-2.10)#20,935 |
| 10. | 00912 | 2.8% | 2.9%(-0.153)#58 | 4.9%(-2.19)#21,312 |
| 11. | 00907 | 2.2% | 2.9%(-0.679)#72 | 4.9%(-2.72)#23,429 |
| 12. | 00923 | 2.1% | 2.9%(-0.823)#77 | 4.9%(-2.86)#23,982 |
| 13. | 00921 | 2.0% | 2.9%(-0.871)#80 | 4.9%(-2.91)#24,153 |
| 14. | 00917 | 1.7% | 2.9%(-1.16)#89 | 4.9%(-3.20)#25,118 |
| 15. | 00918 | 1.1% | 2.9%(-1.84)#107 | 4.9%(-3.87)#26,854 |
| 16. | 00901 | 0.45% | 2.9%(-2.46)#116 | 4.9%(-4.50)#27,878 |
1
Common Questions
What are the Top 10 Zip Codes with the Highest Percentage of Population Employed in Transportation & Warehousing in San Juan, PR?
Top 10 Zip Codes with the Highest Percentage of Population Employed in Transportation & Warehousing in San Juan, PR are:
What zip code has the Highest Percentage of Population Employed in Transportation & Warehousing in San Juan, PR?
00920 has the Highest Percentage of Population Employed in Transportation & Warehousing in San Juan, PR with 6.4%.
What is the Percentage of Population Employed in Transportation & Warehousing in San Juan, PR?
Percentage of Population Employed in Transportation & Warehousing in San Juan is 3.2%.
What is the Percentage of Population Employed in Transportation & Warehousing in Puerto Rico?
Percentage of Population Employed in Transportation & Warehousing in Puerto Rico is 2.9%.
What is the Percentage of Population Employed in Transportation & Warehousing in the United States?
Percentage of Population Employed in Transportation & Warehousing in the United States is 4.9%.