Zip Codes with the Highest Percentage of Local Government Employees in Carolina, PR
RELATED REPORTS & OPTIONS
Local Government Employees
Carolina
Compare Zip Codes
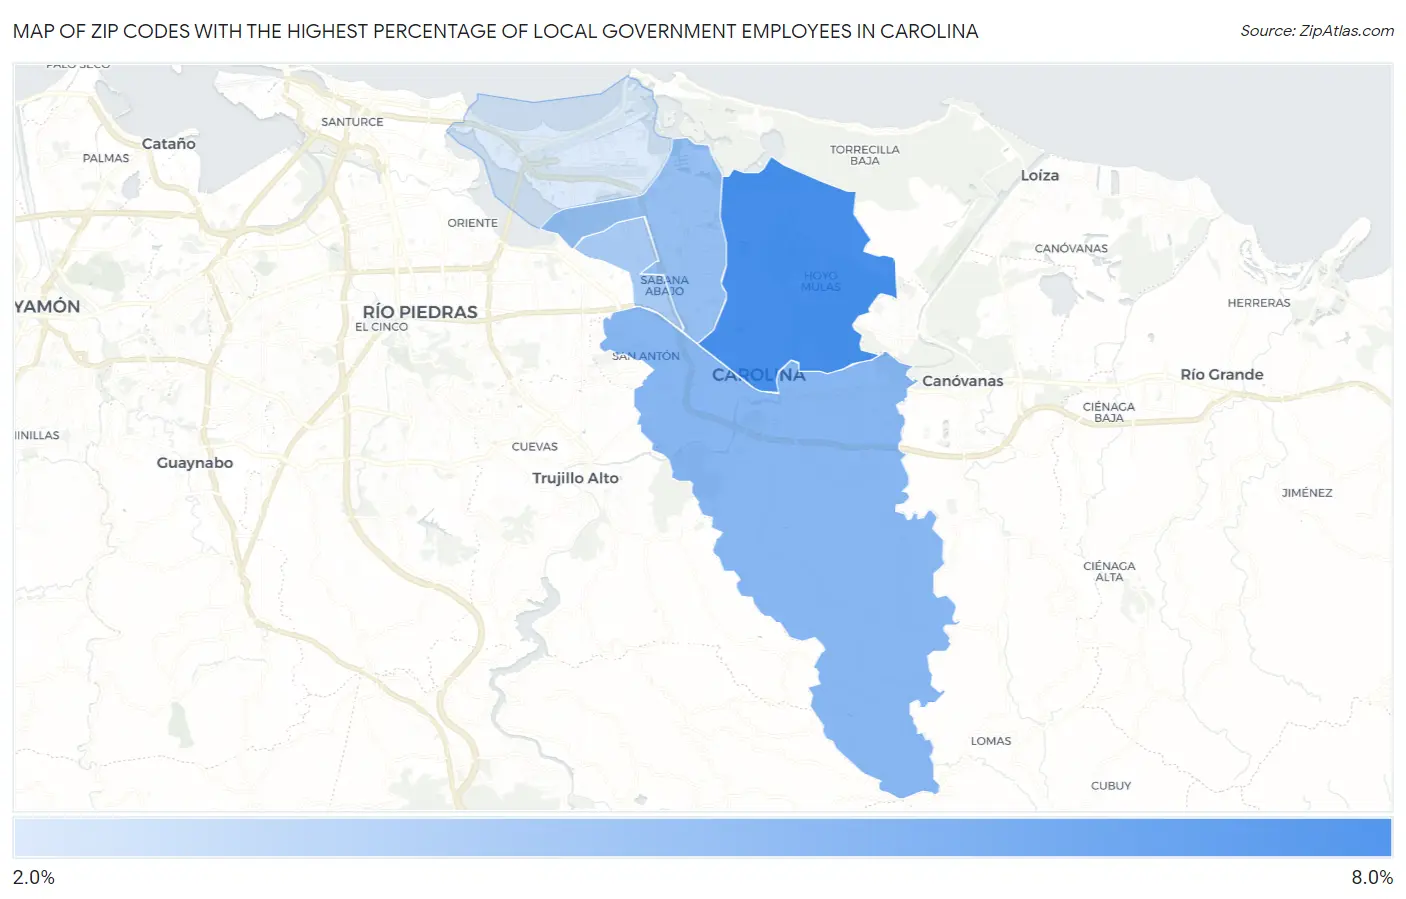
Map of Zip Codes with the Highest Percentage of Local Government Employees in Carolina
2.5%
6.3%
Zip Codes with the Highest Percentage of Local Government Employees in Carolina, PR
| Zip Code | % Local Government Employees | vs State | vs National | |
| 1. | 00985 | 6.3% | 5.6%(+0.772)#53 | 7.2%(-0.890)#18,671 |
| 2. | 00987 | 4.7% | 5.6%(-0.891)#80 | 7.2%(-2.55)#23,963 |
| 3. | 00983 | 4.3% | 5.6%(-1.25)#93 | 7.2%(-2.91)#24,916 |
| 4. | 00982 | 3.9% | 5.6%(-1.69)#99 | 7.2%(-3.35)#25,976 |
| 5. | 00979 | 2.5% | 5.6%(-3.06)#117 | 7.2%(-4.72)#28,187 |
1
Common Questions
What are the Top 3 Zip Codes with the Highest Percentage of Local Government Employees in Carolina, PR?
Top 3 Zip Codes with the Highest Percentage of Local Government Employees in Carolina, PR are:
What zip code has the Highest Percentage of Local Government Employees in Carolina, PR?
00985 has the Highest Percentage of Local Government Employees in Carolina, PR with 6.3%.
What is the Percentage of Local Government Employees in Carolina, PR?
Percentage of Local Government Employees in Carolina is 4.4%.
What is the Percentage of Local Government Employees in Puerto Rico?
Percentage of Local Government Employees in Puerto Rico is 5.6%.
What is the Percentage of Local Government Employees in the United States?
Percentage of Local Government Employees in the United States is 7.2%.