Yup'ik vs Sierra Leonean Single Male Poverty
COMPARE
Yup'ik
Sierra Leonean
Single Male Poverty
Single Male Poverty Comparison
Yup'ik
Sierra Leoneans
31.6%
SINGLE MALE POVERTY
0.0/ 100
METRIC RATING
347th/ 347
METRIC RANK
12.6%
SINGLE MALE POVERTY
73.0/ 100
METRIC RATING
149th/ 347
METRIC RANK
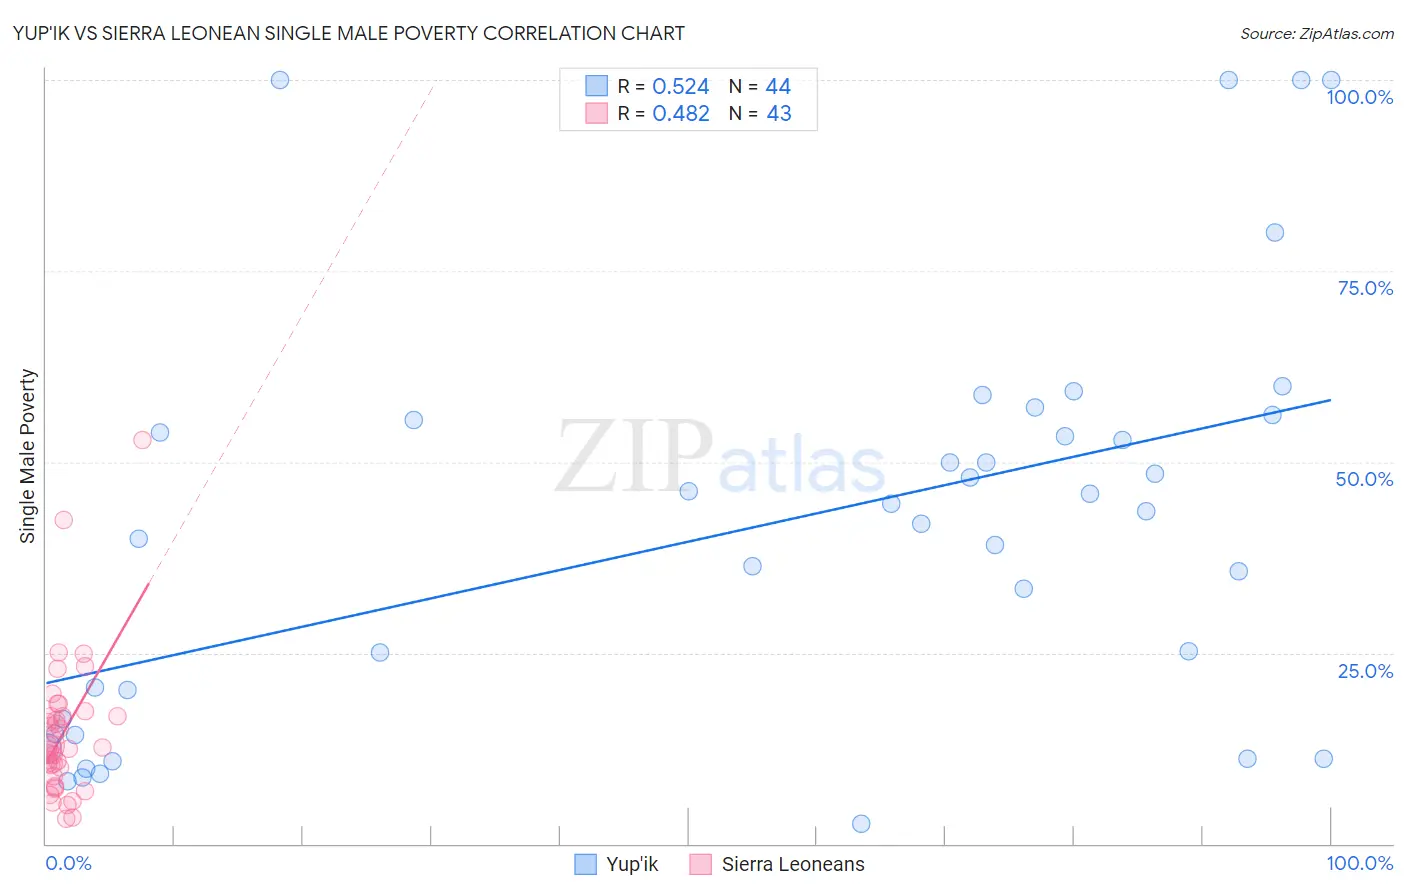
Yup'ik vs Sierra Leonean Single Male Poverty Correlation Chart
The statistical analysis conducted on geographies consisting of 38,853,365 people shows a substantial positive correlation between the proportion of Yup'ik and poverty level among single males in the United States with a correlation coefficient (R) of 0.524 and weighted average of 31.6%. Similarly, the statistical analysis conducted on geographies consisting of 80,419,123 people shows a moderate positive correlation between the proportion of Sierra Leoneans and poverty level among single males in the United States with a correlation coefficient (R) of 0.482 and weighted average of 12.6%, a difference of 150.4%.
Single Male Poverty Correlation Summary
| Measurement | Yup'ik | Sierra Leonean |
| Minimum | 2.6% | 3.2% |
| Maximum | 100.0% | 52.9% |
| Range | 97.4% | 49.7% |
| Mean | 41.1% | 14.5% |
| Median | 42.7% | 12.5% |
| Interquartile 25% (IQ1) | 15.4% | 8.9% |
| Interquartile 75% (IQ3) | 54.7% | 16.8% |
| Interquartile Range (IQR) | 39.3% | 7.9% |
| Standard Deviation (Sample) | 26.6% | 9.3% |
| Standard Deviation (Population) | 26.3% | 9.2% |
Similar Demographics by Single Male Poverty
Demographics Similar to Yup'ik by Single Male Poverty
In terms of single male poverty, the demographic groups most similar to Yup'ik are Hopi (27.5%, a difference of 15.0%), Navajo (25.3%, a difference of 24.8%), Lumbee (25.2%, a difference of 25.7%), Puerto Rican (25.1%, a difference of 26.1%), and Houma (23.5%, a difference of 34.9%).
| Demographics | Rating | Rank | Single Male Poverty |
| Inupiat | 0.0 /100 | #333 | Tragic 20.0% |
| Pima | 0.0 /100 | #334 | Tragic 20.2% |
| Yuman | 0.0 /100 | #335 | Tragic 21.3% |
| Tohono O'odham | 0.0 /100 | #336 | Tragic 21.6% |
| Apache | 0.0 /100 | #337 | Tragic 21.6% |
| Pueblo | 0.0 /100 | #338 | Tragic 21.6% |
| Arapaho | 0.0 /100 | #339 | Tragic 21.9% |
| Sioux | 0.0 /100 | #340 | Tragic 22.2% |
| Crow | 0.0 /100 | #341 | Tragic 23.3% |
| Houma | 0.0 /100 | #342 | Tragic 23.5% |
| Puerto Ricans | 0.0 /100 | #343 | Tragic 25.1% |
| Lumbee | 0.0 /100 | #344 | Tragic 25.2% |
| Navajo | 0.0 /100 | #345 | Tragic 25.3% |
| Hopi | 0.0 /100 | #346 | Tragic 27.5% |
| Yup'ik | 0.0 /100 | #347 | Tragic 31.6% |
Demographics Similar to Sierra Leoneans by Single Male Poverty
In terms of single male poverty, the demographic groups most similar to Sierra Leoneans are Immigrants from Panama (12.6%, a difference of 0.060%), Yugoslavian (12.6%, a difference of 0.070%), Immigrants from Hungary (12.6%, a difference of 0.070%), Australian (12.6%, a difference of 0.11%), and Malaysian (12.6%, a difference of 0.12%).
| Demographics | Rating | Rank | Single Male Poverty |
| Immigrants | Uganda | 75.9 /100 | #142 | Good 12.6% |
| Immigrants | France | 75.8 /100 | #143 | Good 12.6% |
| Hawaiians | 75.1 /100 | #144 | Good 12.6% |
| Immigrants | Lebanon | 75.0 /100 | #145 | Good 12.6% |
| Native Hawaiians | 75.0 /100 | #146 | Good 12.6% |
| Malaysians | 74.8 /100 | #147 | Good 12.6% |
| Yugoslavians | 73.9 /100 | #148 | Good 12.6% |
| Sierra Leoneans | 73.0 /100 | #149 | Good 12.6% |
| Immigrants | Panama | 72.1 /100 | #150 | Good 12.6% |
| Immigrants | Hungary | 71.9 /100 | #151 | Good 12.6% |
| Australians | 71.4 /100 | #152 | Good 12.6% |
| Immigrants | Immigrants | 70.1 /100 | #153 | Good 12.7% |
| Immigrants | Scotland | 68.9 /100 | #154 | Good 12.7% |
| Immigrants | Spain | 68.7 /100 | #155 | Good 12.7% |
| Vietnamese | 67.9 /100 | #156 | Good 12.7% |