Yup'ik vs Indonesian Female Poverty Among 25-34 Year Olds
COMPARE
Yup'ik
Indonesian
Female Poverty Among 25-34 Year Olds
Female Poverty Among 25-34 Year Olds Comparison
Yup'ik
Indonesians
24.3%
FEMALE POVERTY AMONG 25-34 YEAR OLDS
0.0/ 100
METRIC RATING
343rd/ 347
METRIC RANK
16.4%
FEMALE POVERTY AMONG 25-34 YEAR OLDS
0.0/ 100
METRIC RATING
290th/ 347
METRIC RANK
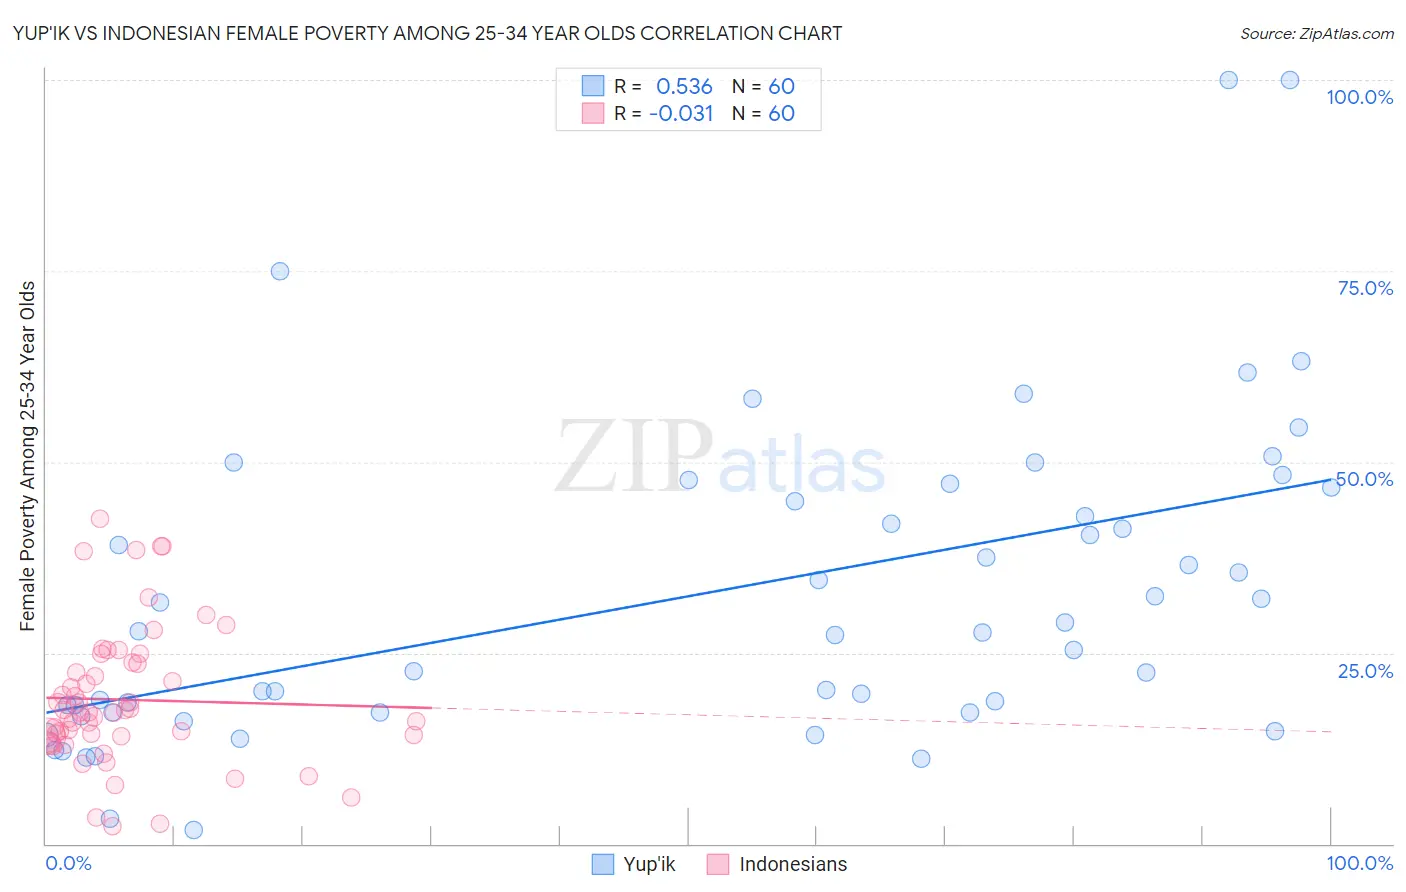
Yup'ik vs Indonesian Female Poverty Among 25-34 Year Olds Correlation Chart
The statistical analysis conducted on geographies consisting of 39,877,637 people shows a substantial positive correlation between the proportion of Yup'ik and poverty level among females between the ages 25 and 34 in the United States with a correlation coefficient (R) of 0.536 and weighted average of 24.3%. Similarly, the statistical analysis conducted on geographies consisting of 161,815,054 people shows no correlation between the proportion of Indonesians and poverty level among females between the ages 25 and 34 in the United States with a correlation coefficient (R) of -0.031 and weighted average of 16.4%, a difference of 48.0%.
Female Poverty Among 25-34 Year Olds Correlation Summary
| Measurement | Yup'ik | Indonesian |
| Minimum | 1.7% | 2.3% |
| Maximum | 100.0% | 42.5% |
| Range | 98.3% | 40.2% |
| Mean | 32.7% | 18.9% |
| Median | 27.7% | 17.2% |
| Interquartile 25% (IQ1) | 17.2% | 14.1% |
| Interquartile 75% (IQ3) | 45.7% | 23.6% |
| Interquartile Range (IQR) | 28.6% | 9.6% |
| Standard Deviation (Sample) | 20.8% | 8.9% |
| Standard Deviation (Population) | 20.6% | 8.9% |
Similar Demographics by Female Poverty Among 25-34 Year Olds
Demographics Similar to Yup'ik by Female Poverty Among 25-34 Year Olds
In terms of female poverty among 25-34 year olds, the demographic groups most similar to Yup'ik are Tohono O'odham (24.7%, a difference of 1.8%), Hopi (23.7%, a difference of 2.7%), Pima (25.3%, a difference of 4.1%), Navajo (23.3%, a difference of 4.1%), and Sioux (23.0%, a difference of 5.9%).
| Demographics | Rating | Rank | Female Poverty Among 25-34 Year Olds |
| Cajuns | 0.0 /100 | #333 | Tragic 19.9% |
| Apache | 0.0 /100 | #334 | Tragic 20.1% |
| Natives/Alaskans | 0.0 /100 | #335 | Tragic 20.3% |
| Pueblo | 0.0 /100 | #336 | Tragic 22.2% |
| Crow | 0.0 /100 | #337 | Tragic 22.7% |
| Houma | 0.0 /100 | #338 | Tragic 22.7% |
| Yuman | 0.0 /100 | #339 | Tragic 22.9% |
| Sioux | 0.0 /100 | #340 | Tragic 23.0% |
| Navajo | 0.0 /100 | #341 | Tragic 23.3% |
| Hopi | 0.0 /100 | #342 | Tragic 23.7% |
| Yup'ik | 0.0 /100 | #343 | Tragic 24.3% |
| Tohono O'odham | 0.0 /100 | #344 | Tragic 24.7% |
| Pima | 0.0 /100 | #345 | Tragic 25.3% |
| Lumbee | 0.0 /100 | #346 | Tragic 26.3% |
| Puerto Ricans | 0.0 /100 | #347 | Tragic 26.3% |
Demographics Similar to Indonesians by Female Poverty Among 25-34 Year Olds
In terms of female poverty among 25-34 year olds, the demographic groups most similar to Indonesians are Osage (16.4%, a difference of 0.16%), Guatemalan (16.4%, a difference of 0.22%), Comanche (16.5%, a difference of 0.28%), Immigrants from Dominica (16.5%, a difference of 0.30%), and American (16.4%, a difference of 0.40%).
| Demographics | Rating | Rank | Female Poverty Among 25-34 Year Olds |
| Bahamians | 0.0 /100 | #283 | Tragic 16.1% |
| Shoshone | 0.0 /100 | #284 | Tragic 16.2% |
| Immigrants | Bahamas | 0.0 /100 | #285 | Tragic 16.3% |
| Cape Verdeans | 0.0 /100 | #286 | Tragic 16.3% |
| Americans | 0.0 /100 | #287 | Tragic 16.4% |
| Guatemalans | 0.0 /100 | #288 | Tragic 16.4% |
| Osage | 0.0 /100 | #289 | Tragic 16.4% |
| Indonesians | 0.0 /100 | #290 | Tragic 16.4% |
| Comanche | 0.0 /100 | #291 | Tragic 16.5% |
| Immigrants | Dominica | 0.0 /100 | #292 | Tragic 16.5% |
| Potawatomi | 0.0 /100 | #293 | Tragic 16.5% |
| Immigrants | Central America | 0.0 /100 | #294 | Tragic 16.6% |
| Mexicans | 0.0 /100 | #295 | Tragic 16.6% |
| Hispanics or Latinos | 0.0 /100 | #296 | Tragic 16.6% |
| Immigrants | Guatemala | 0.0 /100 | #297 | Tragic 16.6% |