Yup'ik vs Czech Single Father Poverty
COMPARE
Yup'ik
Czech
Single Father Poverty
Single Father Poverty Comparison
Yup'ik
Czechs
32.5%
SINGLE FATHER POVERTY
0.0/ 100
METRIC RATING
347th/ 347
METRIC RANK
17.0%
SINGLE FATHER POVERTY
2.3/ 100
METRIC RATING
241st/ 347
METRIC RANK
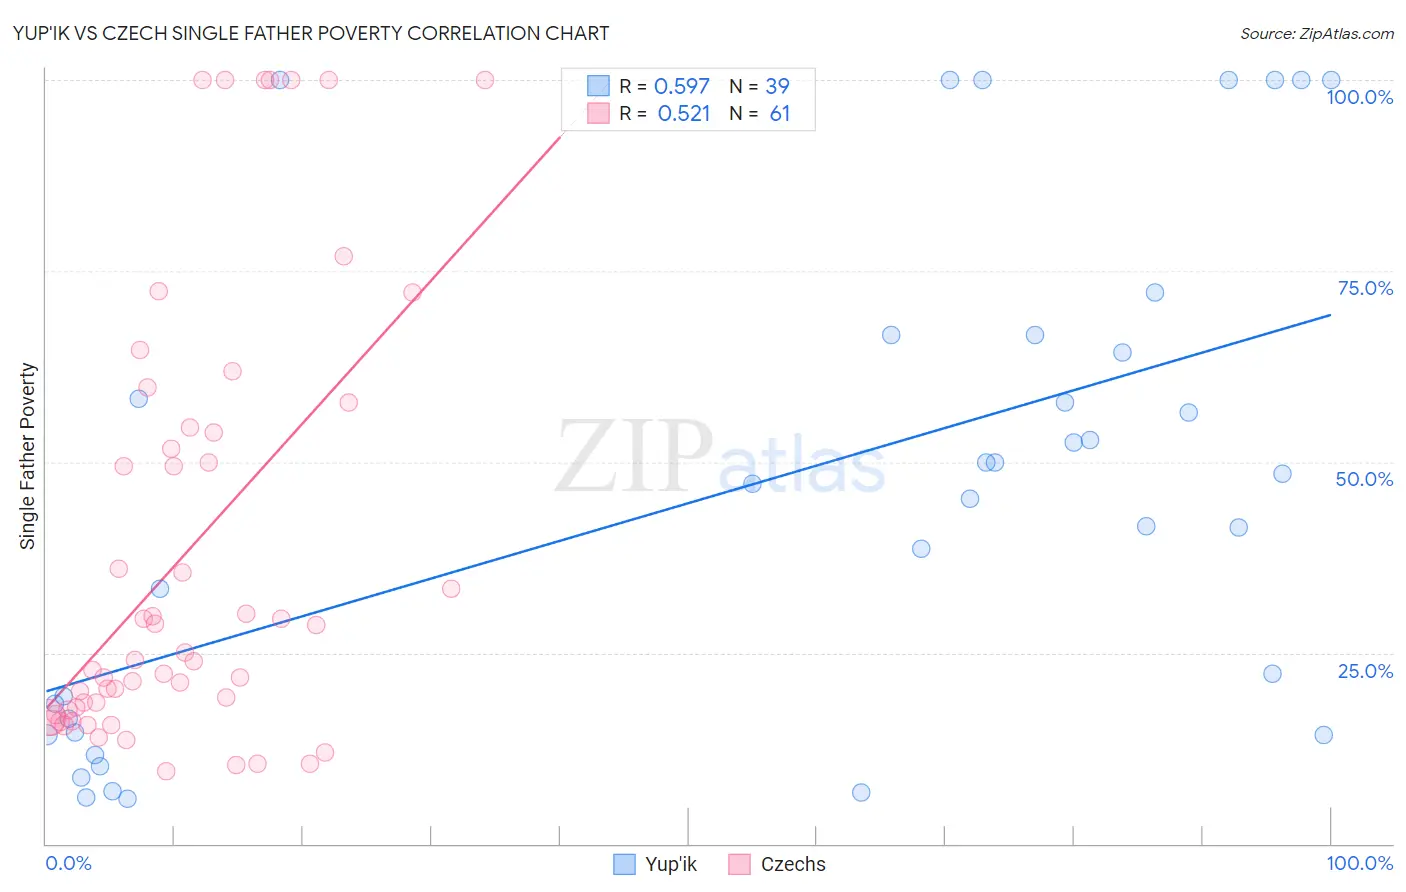
Yup'ik vs Czech Single Father Poverty Correlation Chart
The statistical analysis conducted on geographies consisting of 37,532,100 people shows a substantial positive correlation between the proportion of Yup'ik and poverty level among single fathers in the United States with a correlation coefficient (R) of 0.597 and weighted average of 32.5%. Similarly, the statistical analysis conducted on geographies consisting of 358,801,462 people shows a substantial positive correlation between the proportion of Czechs and poverty level among single fathers in the United States with a correlation coefficient (R) of 0.521 and weighted average of 17.0%, a difference of 91.7%.
Single Father Poverty Correlation Summary
| Measurement | Yup'ik | Czech |
| Minimum | 5.9% | 9.5% |
| Maximum | 100.0% | 100.0% |
| Range | 94.1% | 90.5% |
| Mean | 46.6% | 38.0% |
| Median | 47.1% | 24.1% |
| Interquartile 25% (IQ1) | 14.6% | 17.3% |
| Interquartile 75% (IQ3) | 66.7% | 54.2% |
| Interquartile Range (IQR) | 52.0% | 36.9% |
| Standard Deviation (Sample) | 32.1% | 28.4% |
| Standard Deviation (Population) | 31.7% | 28.2% |
Similar Demographics by Single Father Poverty
Demographics Similar to Yup'ik by Single Father Poverty
In terms of single father poverty, the demographic groups most similar to Yup'ik are Puerto Rican (31.5%, a difference of 3.2%), Crow (30.3%, a difference of 7.4%), Navajo (29.2%, a difference of 11.3%), Lumbee (28.5%, a difference of 14.2%), and Yuman (28.4%, a difference of 14.6%).
| Demographics | Rating | Rank | Single Father Poverty |
| Natives/Alaskans | 0.0 /100 | #333 | Tragic 22.4% |
| Kiowa | 0.0 /100 | #334 | Tragic 22.5% |
| Shoshone | 0.0 /100 | #335 | Tragic 22.9% |
| Cajuns | 0.0 /100 | #336 | Tragic 23.1% |
| Sioux | 0.0 /100 | #337 | Tragic 23.9% |
| Arapaho | 0.0 /100 | #338 | Tragic 24.0% |
| Apache | 0.0 /100 | #339 | Tragic 24.2% |
| Houma | 0.0 /100 | #340 | Tragic 26.7% |
| Hopi | 0.0 /100 | #341 | Tragic 27.2% |
| Yuman | 0.0 /100 | #342 | Tragic 28.4% |
| Lumbee | 0.0 /100 | #343 | Tragic 28.5% |
| Navajo | 0.0 /100 | #344 | Tragic 29.2% |
| Crow | 0.0 /100 | #345 | Tragic 30.3% |
| Puerto Ricans | 0.0 /100 | #346 | Tragic 31.5% |
| Yup'ik | 0.0 /100 | #347 | Tragic 32.5% |
Demographics Similar to Czechs by Single Father Poverty
In terms of single father poverty, the demographic groups most similar to Czechs are Moroccan (17.0%, a difference of 0.10%), Finnish (16.9%, a difference of 0.12%), Bermudan (16.9%, a difference of 0.13%), Immigrants from Saudi Arabia (16.9%, a difference of 0.15%), and Subsaharan African (16.9%, a difference of 0.22%).
| Demographics | Rating | Rank | Single Father Poverty |
| Marshallese | 3.1 /100 | #234 | Tragic 16.9% |
| Immigrants | Western Europe | 2.9 /100 | #235 | Tragic 16.9% |
| Immigrants | Germany | 2.9 /100 | #236 | Tragic 16.9% |
| Sub-Saharan Africans | 2.9 /100 | #237 | Tragic 16.9% |
| Immigrants | Saudi Arabia | 2.7 /100 | #238 | Tragic 16.9% |
| Bermudans | 2.6 /100 | #239 | Tragic 16.9% |
| Finns | 2.6 /100 | #240 | Tragic 16.9% |
| Czechs | 2.3 /100 | #241 | Tragic 17.0% |
| Moroccans | 2.1 /100 | #242 | Tragic 17.0% |
| Immigrants | Cabo Verde | 1.6 /100 | #243 | Tragic 17.0% |
| Hondurans | 1.6 /100 | #244 | Tragic 17.0% |
| Trinidadians and Tobagonians | 1.5 /100 | #245 | Tragic 17.0% |
| Immigrants | Ireland | 1.4 /100 | #246 | Tragic 17.1% |
| Greeks | 1.3 /100 | #247 | Tragic 17.1% |
| Czechoslovakians | 1.3 /100 | #248 | Tragic 17.1% |