Yuman vs Immigrants from Germany Male Poverty
COMPARE
Yuman
Immigrants from Germany
Male Poverty
Male Poverty Comparison
Yuman
Immigrants from Germany
19.5%
MALE POVERTY
0.0/ 100
METRIC RATING
339th/ 347
METRIC RANK
10.9%
MALE POVERTY
71.6/ 100
METRIC RATING
145th/ 347
METRIC RANK
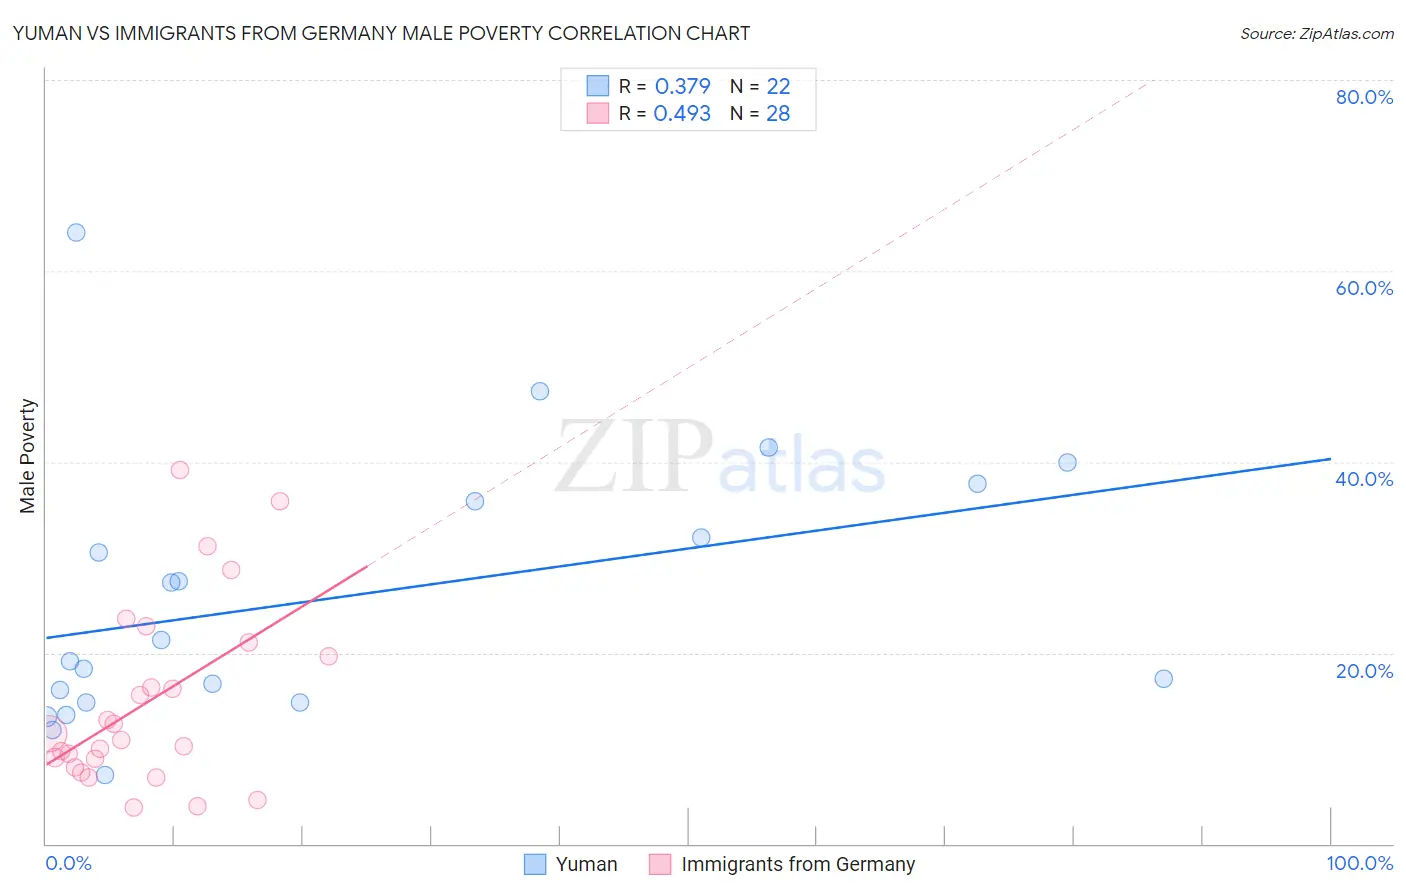
Yuman vs Immigrants from Germany Male Poverty Correlation Chart
The statistical analysis conducted on geographies consisting of 40,667,603 people shows a mild positive correlation between the proportion of Yuman and poverty level among males in the United States with a correlation coefficient (R) of 0.379 and weighted average of 19.5%. Similarly, the statistical analysis conducted on geographies consisting of 463,516,285 people shows a moderate positive correlation between the proportion of Immigrants from Germany and poverty level among males in the United States with a correlation coefficient (R) of 0.493 and weighted average of 10.9%, a difference of 78.8%.
Male Poverty Correlation Summary
| Measurement | Yuman | Immigrants from Germany |
| Minimum | 7.2% | 3.8% |
| Maximum | 64.1% | 39.2% |
| Range | 56.9% | 35.4% |
| Mean | 25.8% | 14.9% |
| Median | 20.2% | 11.2% |
| Interquartile 25% (IQ1) | 14.8% | 8.5% |
| Interquartile 75% (IQ3) | 35.9% | 20.4% |
| Interquartile Range (IQR) | 21.1% | 11.9% |
| Standard Deviation (Sample) | 14.1% | 9.6% |
| Standard Deviation (Population) | 13.7% | 9.4% |
Similar Demographics by Male Poverty
Demographics Similar to Yuman by Male Poverty
In terms of male poverty, the demographic groups most similar to Yuman are Crow (19.1%, a difference of 2.2%), Immigrants from Yemen (20.1%, a difference of 3.1%), Lumbee (20.2%, a difference of 3.4%), Pima (20.4%, a difference of 4.2%), and Yup'ik (20.4%, a difference of 4.3%).
| Demographics | Rating | Rank | Male Poverty |
| Houma | 0.0 /100 | #332 | Tragic 16.7% |
| Natives/Alaskans | 0.0 /100 | #333 | Tragic 16.9% |
| Cheyenne | 0.0 /100 | #334 | Tragic 17.6% |
| Apache | 0.0 /100 | #335 | Tragic 17.7% |
| Pueblo | 0.0 /100 | #336 | Tragic 18.5% |
| Sioux | 0.0 /100 | #337 | Tragic 18.7% |
| Crow | 0.0 /100 | #338 | Tragic 19.1% |
| Yuman | 0.0 /100 | #339 | Tragic 19.5% |
| Immigrants | Yemen | 0.0 /100 | #340 | Tragic 20.1% |
| Lumbee | 0.0 /100 | #341 | Tragic 20.2% |
| Pima | 0.0 /100 | #342 | Tragic 20.4% |
| Yup'ik | 0.0 /100 | #343 | Tragic 20.4% |
| Hopi | 0.0 /100 | #344 | Tragic 20.8% |
| Puerto Ricans | 0.0 /100 | #345 | Tragic 22.0% |
| Navajo | 0.0 /100 | #346 | Tragic 22.3% |
Demographics Similar to Immigrants from Germany by Male Poverty
In terms of male poverty, the demographic groups most similar to Immigrants from Germany are Samoan (10.9%, a difference of 0.020%), Syrian (10.9%, a difference of 0.030%), Afghan (10.9%, a difference of 0.040%), Icelander (11.0%, a difference of 0.37%), and Basque (10.9%, a difference of 0.38%).
| Demographics | Rating | Rank | Male Poverty |
| Yugoslavians | 78.2 /100 | #138 | Good 10.8% |
| Immigrants | Jordan | 77.5 /100 | #139 | Good 10.8% |
| Tlingit-Haida | 76.1 /100 | #140 | Good 10.9% |
| Immigrants | France | 75.8 /100 | #141 | Good 10.9% |
| Basques | 74.6 /100 | #142 | Good 10.9% |
| Afghans | 71.9 /100 | #143 | Good 10.9% |
| Samoans | 71.8 /100 | #144 | Good 10.9% |
| Immigrants | Germany | 71.6 /100 | #145 | Good 10.9% |
| Syrians | 71.4 /100 | #146 | Good 10.9% |
| Icelanders | 68.5 /100 | #147 | Good 11.0% |
| Armenians | 68.0 /100 | #148 | Good 11.0% |
| Immigrants | Venezuela | 67.9 /100 | #149 | Good 11.0% |
| Guamanians/Chamorros | 67.6 /100 | #150 | Good 11.0% |
| Venezuelans | 67.4 /100 | #151 | Good 11.0% |
| Immigrants | Nepal | 67.3 /100 | #152 | Good 11.0% |