Yuman vs Aleut Receiving Food Stamps
COMPARE
Yuman
Aleut
Receiving Food Stamps
Receiving Food Stamps Comparison
Yuman
Aleuts
20.2%
RECEIVING FOOD STAMPS
0.0/ 100
METRIC RATING
334th/ 347
METRIC RANK
12.4%
RECEIVING FOOD STAMPS
17.3/ 100
METRIC RATING
205th/ 347
METRIC RANK
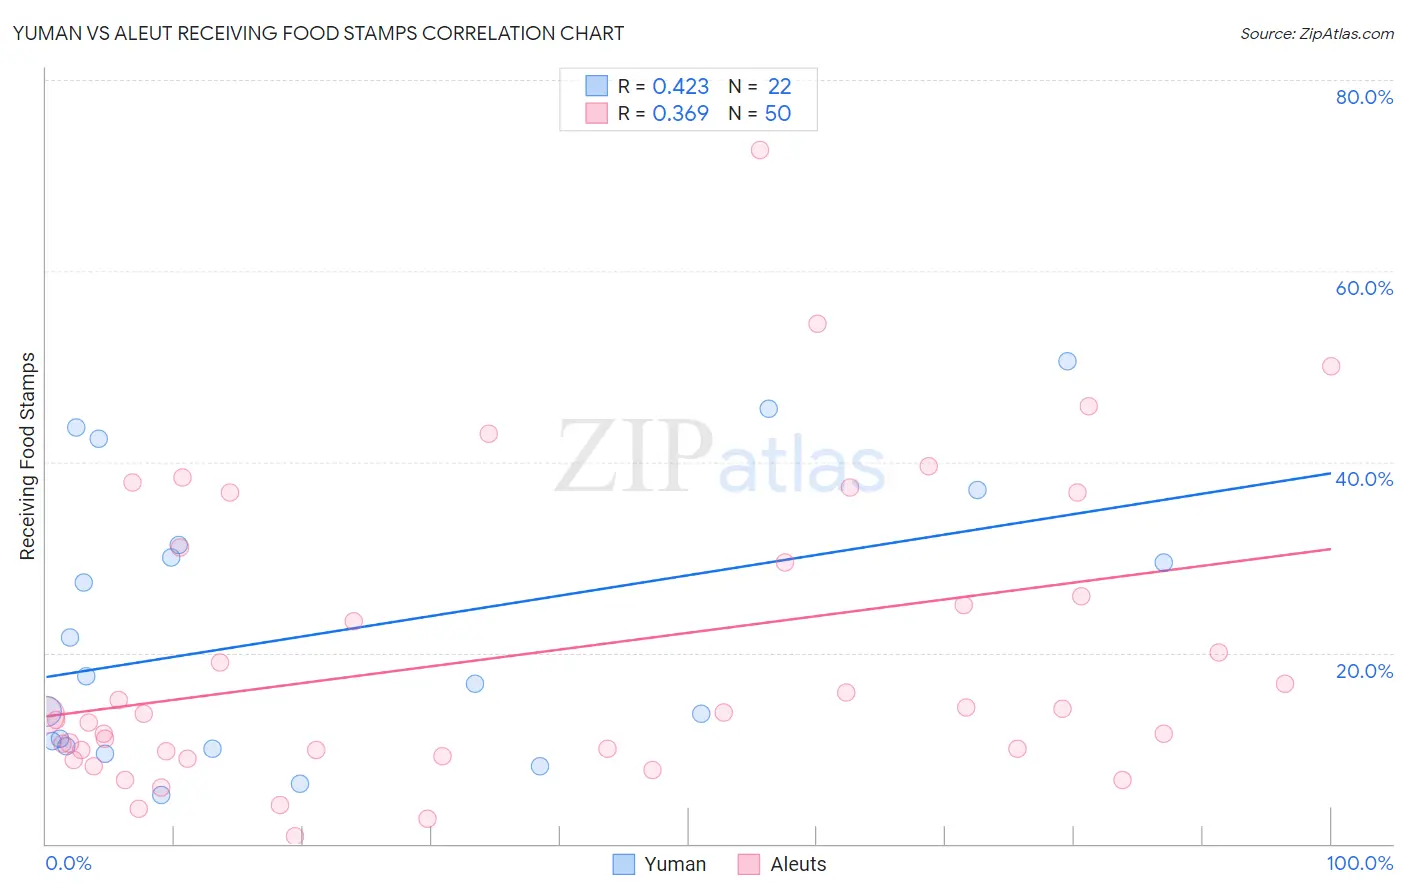
Yuman vs Aleut Receiving Food Stamps Correlation Chart
The statistical analysis conducted on geographies consisting of 40,663,437 people shows a moderate positive correlation between the proportion of Yuman and percentage of population receiving government assistance and/or food stamps in the United States with a correlation coefficient (R) of 0.423 and weighted average of 20.2%. Similarly, the statistical analysis conducted on geographies consisting of 61,758,558 people shows a mild positive correlation between the proportion of Aleuts and percentage of population receiving government assistance and/or food stamps in the United States with a correlation coefficient (R) of 0.369 and weighted average of 12.4%, a difference of 63.3%.
Receiving Food Stamps Correlation Summary
| Measurement | Yuman | Aleut |
| Minimum | 5.1% | 0.80% |
| Maximum | 50.6% | 72.7% |
| Range | 45.5% | 71.9% |
| Mean | 22.3% | 19.7% |
| Median | 17.1% | 13.5% |
| Interquartile 25% (IQ1) | 10.2% | 9.7% |
| Interquartile 75% (IQ3) | 31.3% | 29.4% |
| Interquartile Range (IQR) | 21.1% | 19.7% |
| Standard Deviation (Sample) | 14.3% | 15.6% |
| Standard Deviation (Population) | 14.0% | 15.4% |
Similar Demographics by Receiving Food Stamps
Demographics Similar to Yuman by Receiving Food Stamps
In terms of receiving food stamps, the demographic groups most similar to Yuman are Inupiat (20.1%, a difference of 0.86%), Pueblo (19.9%, a difference of 1.6%), Immigrants from Cuba (20.8%, a difference of 2.9%), Immigrants from Caribbean (19.6%, a difference of 3.1%), and Navajo (21.1%, a difference of 4.1%).
| Demographics | Rating | Rank | Receiving Food Stamps |
| Apache | 0.0 /100 | #327 | Tragic 18.3% |
| Colville | 0.0 /100 | #328 | Tragic 18.3% |
| Immigrants | Dominica | 0.0 /100 | #329 | Tragic 18.4% |
| Pima | 0.0 /100 | #330 | Tragic 19.0% |
| Immigrants | Caribbean | 0.0 /100 | #331 | Tragic 19.6% |
| Pueblo | 0.0 /100 | #332 | Tragic 19.9% |
| Inupiat | 0.0 /100 | #333 | Tragic 20.1% |
| Yuman | 0.0 /100 | #334 | Tragic 20.2% |
| Immigrants | Cuba | 0.0 /100 | #335 | Tragic 20.8% |
| Navajo | 0.0 /100 | #336 | Tragic 21.1% |
| Cape Verdeans | 0.0 /100 | #337 | Tragic 21.1% |
| Dominicans | 0.0 /100 | #338 | Tragic 21.4% |
| Yakama | 0.0 /100 | #339 | Tragic 21.4% |
| Tohono O'odham | 0.0 /100 | #340 | Tragic 21.5% |
| Hopi | 0.0 /100 | #341 | Tragic 21.6% |
Demographics Similar to Aleuts by Receiving Food Stamps
In terms of receiving food stamps, the demographic groups most similar to Aleuts are Immigrants from Thailand (12.4%, a difference of 0.060%), Nonimmigrants (12.4%, a difference of 0.070%), Shoshone (12.4%, a difference of 0.090%), South American (12.4%, a difference of 0.33%), and Immigrants from Venezuela (12.3%, a difference of 0.62%).
| Demographics | Rating | Rank | Receiving Food Stamps |
| Immigrants | Costa Rica | 25.4 /100 | #198 | Fair 12.2% |
| Portuguese | 25.1 /100 | #199 | Fair 12.2% |
| Sierra Leoneans | 23.6 /100 | #200 | Fair 12.2% |
| Ugandans | 22.5 /100 | #201 | Fair 12.2% |
| Immigrants | Venezuela | 20.1 /100 | #202 | Fair 12.3% |
| Shoshone | 17.7 /100 | #203 | Poor 12.4% |
| Immigrants | Nonimmigrants | 17.6 /100 | #204 | Poor 12.4% |
| Aleuts | 17.3 /100 | #205 | Poor 12.4% |
| Immigrants | Thailand | 17.0 /100 | #206 | Poor 12.4% |
| South Americans | 16.0 /100 | #207 | Poor 12.4% |
| Potawatomi | 14.6 /100 | #208 | Poor 12.5% |
| Immigrants | Sierra Leone | 12.9 /100 | #209 | Poor 12.5% |
| Immigrants | Uruguay | 12.8 /100 | #210 | Poor 12.5% |
| Colombians | 10.2 /100 | #211 | Poor 12.6% |
| Malaysians | 8.5 /100 | #212 | Tragic 12.7% |