Yakama vs Immigrants from Switzerland Female Poverty Among 18-24 Year Olds
COMPARE
Yakama
Immigrants from Switzerland
Female Poverty Among 18-24 Year Olds
Female Poverty Among 18-24 Year Olds Comparison
Yakama
Immigrants from Switzerland
25.3%
FEMALE POVERTY AMONG 18-24 YEAR OLDS
0.0/ 100
METRIC RATING
326th/ 347
METRIC RANK
21.8%
FEMALE POVERTY AMONG 18-24 YEAR OLDS
0.1/ 100
METRIC RATING
277th/ 347
METRIC RANK
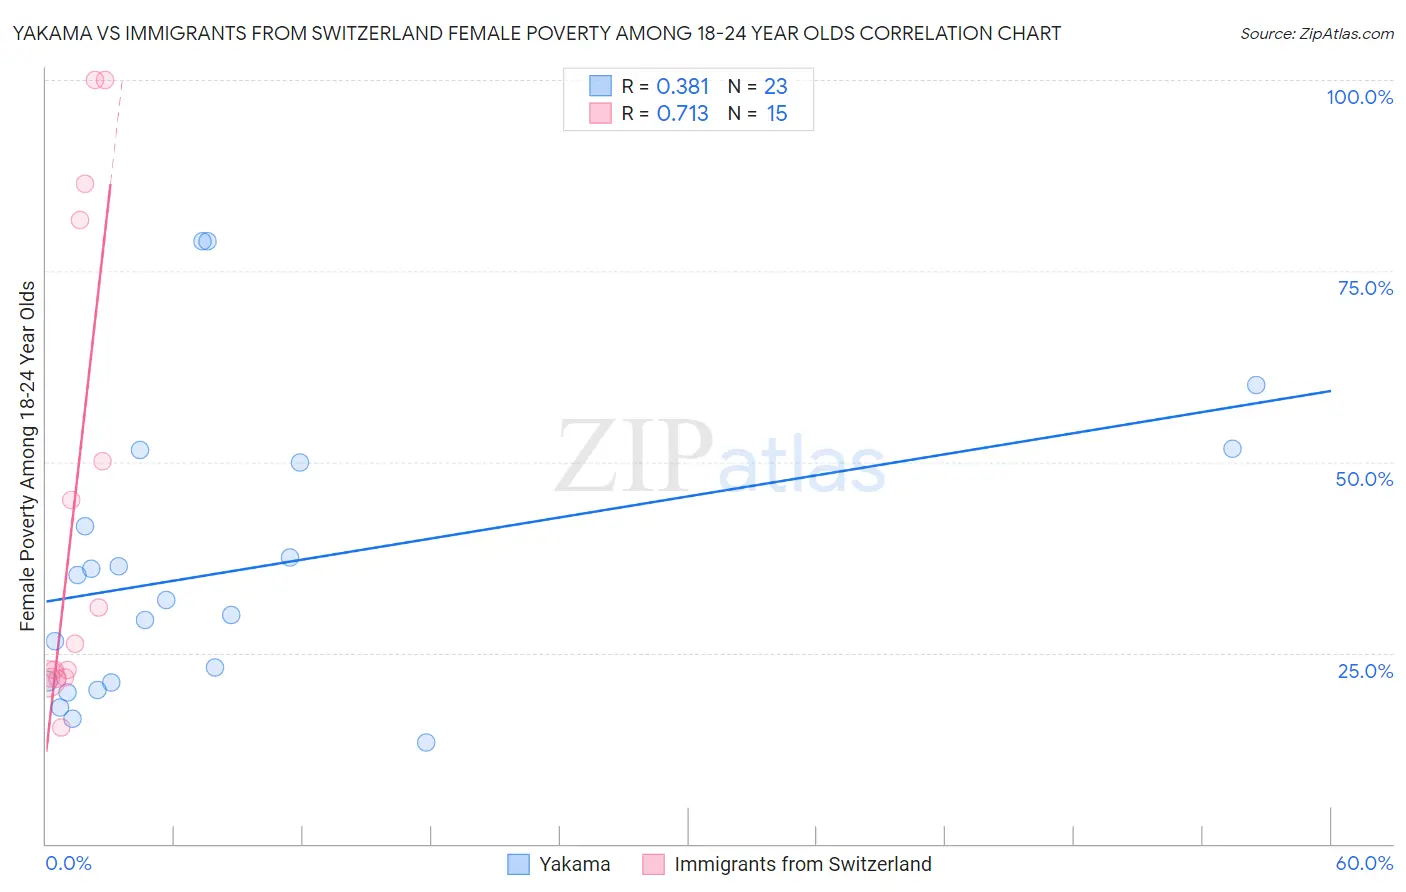
Yakama vs Immigrants from Switzerland Female Poverty Among 18-24 Year Olds Correlation Chart
The statistical analysis conducted on geographies consisting of 19,755,262 people shows a mild positive correlation between the proportion of Yakama and poverty level among females between the ages 18 and 24 in the United States with a correlation coefficient (R) of 0.381 and weighted average of 25.3%. Similarly, the statistical analysis conducted on geographies consisting of 145,929,420 people shows a strong positive correlation between the proportion of Immigrants from Switzerland and poverty level among females between the ages 18 and 24 in the United States with a correlation coefficient (R) of 0.713 and weighted average of 21.8%, a difference of 16.1%.
Female Poverty Among 18-24 Year Olds Correlation Summary
| Measurement | Yakama | Immigrants from Switzerland |
| Minimum | 13.3% | 15.3% |
| Maximum | 78.9% | 100.0% |
| Range | 65.6% | 84.7% |
| Mean | 36.0% | 44.5% |
| Median | 31.9% | 26.2% |
| Interquartile 25% (IQ1) | 21.1% | 21.7% |
| Interquartile 75% (IQ3) | 50.0% | 81.7% |
| Interquartile Range (IQR) | 28.9% | 59.9% |
| Standard Deviation (Sample) | 18.5% | 31.3% |
| Standard Deviation (Population) | 18.1% | 30.3% |
Similar Demographics by Female Poverty Among 18-24 Year Olds
Demographics Similar to Yakama by Female Poverty Among 18-24 Year Olds
In terms of female poverty among 18-24 year olds, the demographic groups most similar to Yakama are Ute (25.4%, a difference of 0.23%), Immigrants from Saudi Arabia (25.3%, a difference of 0.25%), Native/Alaskan (25.4%, a difference of 0.29%), German Russian (25.2%, a difference of 0.68%), and Arapaho (25.2%, a difference of 0.71%).
| Demographics | Rating | Rank | Female Poverty Among 18-24 Year Olds |
| Dutch West Indians | 0.0 /100 | #319 | Tragic 24.5% |
| Immigrants | Congo | 0.0 /100 | #320 | Tragic 24.6% |
| Immigrants | Zaire | 0.0 /100 | #321 | Tragic 25.1% |
| Somalis | 0.0 /100 | #322 | Tragic 25.1% |
| Arapaho | 0.0 /100 | #323 | Tragic 25.2% |
| German Russians | 0.0 /100 | #324 | Tragic 25.2% |
| Immigrants | Saudi Arabia | 0.0 /100 | #325 | Tragic 25.3% |
| Yakama | 0.0 /100 | #326 | Tragic 25.3% |
| Ute | 0.0 /100 | #327 | Tragic 25.4% |
| Natives/Alaskans | 0.0 /100 | #328 | Tragic 25.4% |
| Cajuns | 0.0 /100 | #329 | Tragic 25.7% |
| Immigrants | Somalia | 0.0 /100 | #330 | Tragic 25.7% |
| Chippewa | 0.0 /100 | #331 | Tragic 25.9% |
| Houma | 0.0 /100 | #332 | Tragic 26.2% |
| Apache | 0.0 /100 | #333 | Tragic 26.3% |
Demographics Similar to Immigrants from Switzerland by Female Poverty Among 18-24 Year Olds
In terms of female poverty among 18-24 year olds, the demographic groups most similar to Immigrants from Switzerland are Bahamian (21.8%, a difference of 0.13%), Immigrants from Bangladesh (21.8%, a difference of 0.15%), Immigrants from Honduras (21.8%, a difference of 0.19%), Yaqui (21.9%, a difference of 0.26%), and Spanish American (21.9%, a difference of 0.43%).
| Demographics | Rating | Rank | Female Poverty Among 18-24 Year Olds |
| Mongolians | 0.2 /100 | #270 | Tragic 21.6% |
| Scotch-Irish | 0.2 /100 | #271 | Tragic 21.6% |
| Basques | 0.2 /100 | #272 | Tragic 21.7% |
| New Zealanders | 0.2 /100 | #273 | Tragic 21.7% |
| Immigrants | Honduras | 0.1 /100 | #274 | Tragic 21.8% |
| Immigrants | Bangladesh | 0.1 /100 | #275 | Tragic 21.8% |
| Bahamians | 0.1 /100 | #276 | Tragic 21.8% |
| Immigrants | Switzerland | 0.1 /100 | #277 | Tragic 21.8% |
| Yaqui | 0.1 /100 | #278 | Tragic 21.9% |
| Spanish Americans | 0.1 /100 | #279 | Tragic 21.9% |
| Immigrants | Dominica | 0.1 /100 | #280 | Tragic 21.9% |
| Immigrants | Dominican Republic | 0.1 /100 | #281 | Tragic 21.9% |
| Bermudans | 0.1 /100 | #282 | Tragic 21.9% |
| Sub-Saharan Africans | 0.0 /100 | #283 | Tragic 22.0% |
| Tlingit-Haida | 0.0 /100 | #284 | Tragic 22.0% |