Yakama vs Immigrants from Bolivia Child Poverty Among Boys Under 16
COMPARE
Yakama
Immigrants from Bolivia
Child Poverty Among Boys Under 16
Child Poverty Among Boys Under 16 Comparison
Yakama
Immigrants from Bolivia
21.7%
CHILD POVERTY AMONG BOYS UNDER 16
0.0/ 100
METRIC RATING
318th/ 347
METRIC RANK
13.5%
CHILD POVERTY AMONG BOYS UNDER 16
99.8/ 100
METRIC RATING
26th/ 347
METRIC RANK
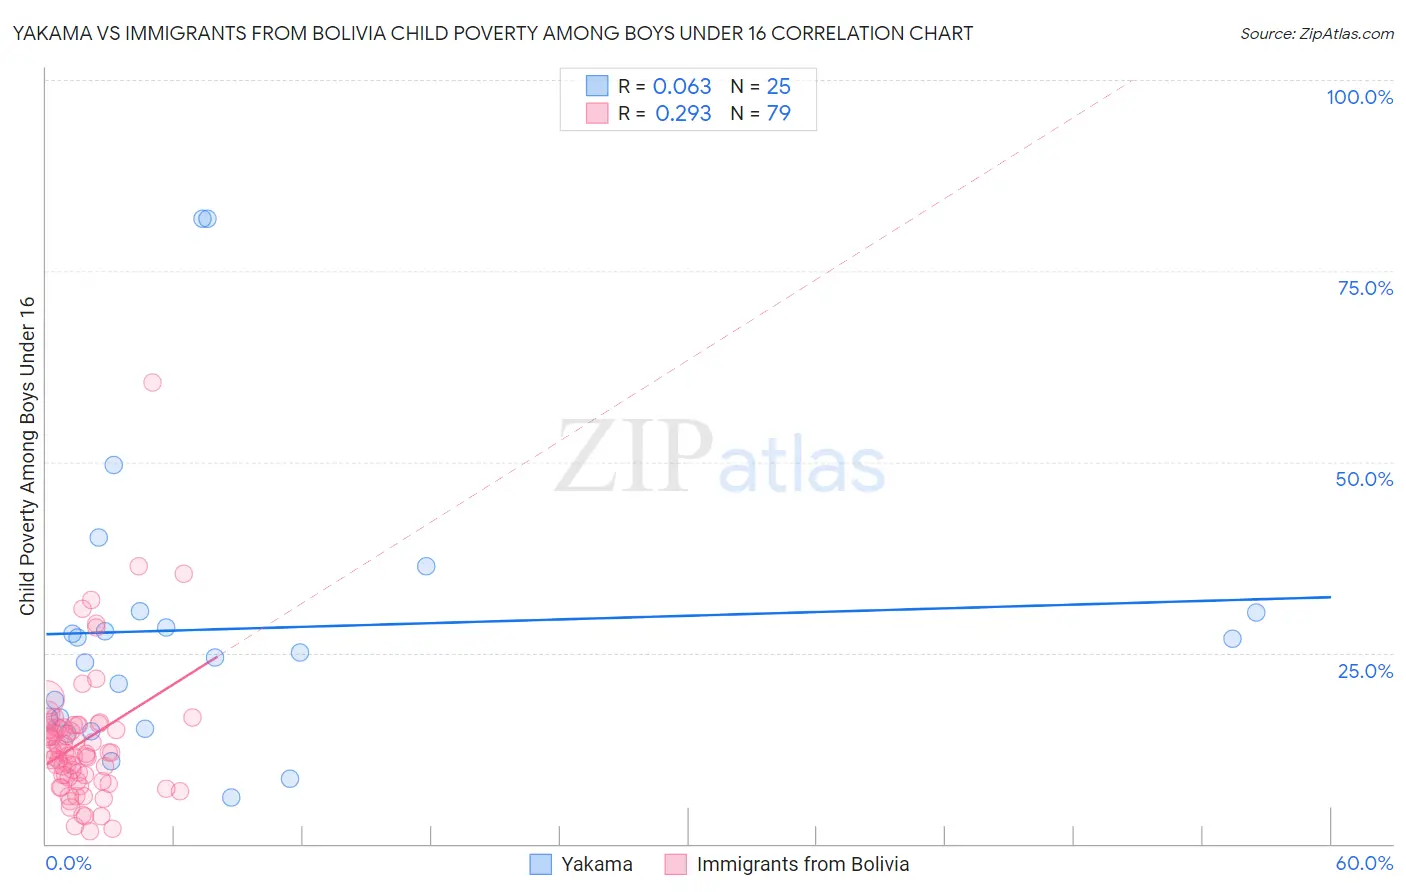
Yakama vs Immigrants from Bolivia Child Poverty Among Boys Under 16 Correlation Chart
The statistical analysis conducted on geographies consisting of 19,821,804 people shows a slight positive correlation between the proportion of Yakama and poverty level among boys under the age of 16 in the United States with a correlation coefficient (R) of 0.063 and weighted average of 21.7%. Similarly, the statistical analysis conducted on geographies consisting of 157,748,153 people shows a weak positive correlation between the proportion of Immigrants from Bolivia and poverty level among boys under the age of 16 in the United States with a correlation coefficient (R) of 0.293 and weighted average of 13.5%, a difference of 60.9%.
Child Poverty Among Boys Under 16 Correlation Summary
| Measurement | Yakama | Immigrants from Bolivia |
| Minimum | 6.1% | 1.6% |
| Maximum | 81.8% | 60.4% |
| Range | 75.8% | 58.8% |
| Mean | 28.1% | 13.3% |
| Median | 25.0% | 11.9% |
| Interquartile 25% (IQ1) | 15.7% | 8.2% |
| Interquartile 75% (IQ3) | 30.4% | 15.2% |
| Interquartile Range (IQR) | 14.7% | 7.0% |
| Standard Deviation (Sample) | 18.9% | 8.8% |
| Standard Deviation (Population) | 18.6% | 8.8% |
Similar Demographics by Child Poverty Among Boys Under 16
Demographics Similar to Yakama by Child Poverty Among Boys Under 16
In terms of child poverty among boys under 16, the demographic groups most similar to Yakama are African (21.7%, a difference of 0.060%), Immigrants from Somalia (21.7%, a difference of 0.14%), Menominee (21.7%, a difference of 0.14%), Dutch West Indian (21.8%, a difference of 0.48%), and Ute (21.6%, a difference of 0.74%).
| Demographics | Rating | Rank | Child Poverty Among Boys Under 16 |
| Bahamians | 0.0 /100 | #311 | Tragic 21.6% |
| Immigrants | Guatemala | 0.0 /100 | #312 | Tragic 21.6% |
| British West Indians | 0.0 /100 | #313 | Tragic 21.6% |
| Ute | 0.0 /100 | #314 | Tragic 21.6% |
| Immigrants | Somalia | 0.0 /100 | #315 | Tragic 21.7% |
| Menominee | 0.0 /100 | #316 | Tragic 21.7% |
| Africans | 0.0 /100 | #317 | Tragic 21.7% |
| Yakama | 0.0 /100 | #318 | Tragic 21.7% |
| Dutch West Indians | 0.0 /100 | #319 | Tragic 21.8% |
| U.S. Virgin Islanders | 0.0 /100 | #320 | Tragic 22.0% |
| Cajuns | 0.0 /100 | #321 | Tragic 22.2% |
| Immigrants | Dominica | 0.0 /100 | #322 | Tragic 22.2% |
| Hondurans | 0.0 /100 | #323 | Tragic 22.3% |
| Immigrants | Congo | 0.0 /100 | #324 | Tragic 22.4% |
| Central American Indians | 0.0 /100 | #325 | Tragic 22.5% |
Demographics Similar to Immigrants from Bolivia by Child Poverty Among Boys Under 16
In terms of child poverty among boys under 16, the demographic groups most similar to Immigrants from Bolivia are Okinawan (13.5%, a difference of 0.080%), Asian (13.5%, a difference of 0.080%), Eastern European (13.5%, a difference of 0.15%), Immigrants from Lithuania (13.5%, a difference of 0.20%), and Cypriot (13.6%, a difference of 0.34%).
| Demographics | Rating | Rank | Child Poverty Among Boys Under 16 |
| Bolivians | 99.9 /100 | #19 | Exceptional 13.3% |
| Indians (Asian) | 99.9 /100 | #20 | Exceptional 13.3% |
| Immigrants | Eastern Asia | 99.9 /100 | #21 | Exceptional 13.3% |
| Tongans | 99.9 /100 | #22 | Exceptional 13.4% |
| Latvians | 99.9 /100 | #23 | Exceptional 13.4% |
| Immigrants | Lithuania | 99.8 /100 | #24 | Exceptional 13.5% |
| Okinawans | 99.8 /100 | #25 | Exceptional 13.5% |
| Immigrants | Bolivia | 99.8 /100 | #26 | Exceptional 13.5% |
| Asians | 99.8 /100 | #27 | Exceptional 13.5% |
| Eastern Europeans | 99.8 /100 | #28 | Exceptional 13.5% |
| Cypriots | 99.8 /100 | #29 | Exceptional 13.6% |
| Swedes | 99.8 /100 | #30 | Exceptional 13.6% |
| Turks | 99.8 /100 | #31 | Exceptional 13.6% |
| Immigrants | China | 99.8 /100 | #32 | Exceptional 13.6% |
| Danes | 99.8 /100 | #33 | Exceptional 13.6% |