White/Caucasian vs Uruguayan Child Poverty Among Boys Under 16
COMPARE
White/Caucasian
Uruguayan
Child Poverty Among Boys Under 16
Child Poverty Among Boys Under 16 Comparison
Whites/Caucasians
Uruguayans
16.5%
CHILD POVERTY AMONG BOYS UNDER 16
48.2/ 100
METRIC RATING
176th/ 347
METRIC RANK
16.4%
CHILD POVERTY AMONG BOYS UNDER 16
50.0/ 100
METRIC RATING
174th/ 347
METRIC RANK
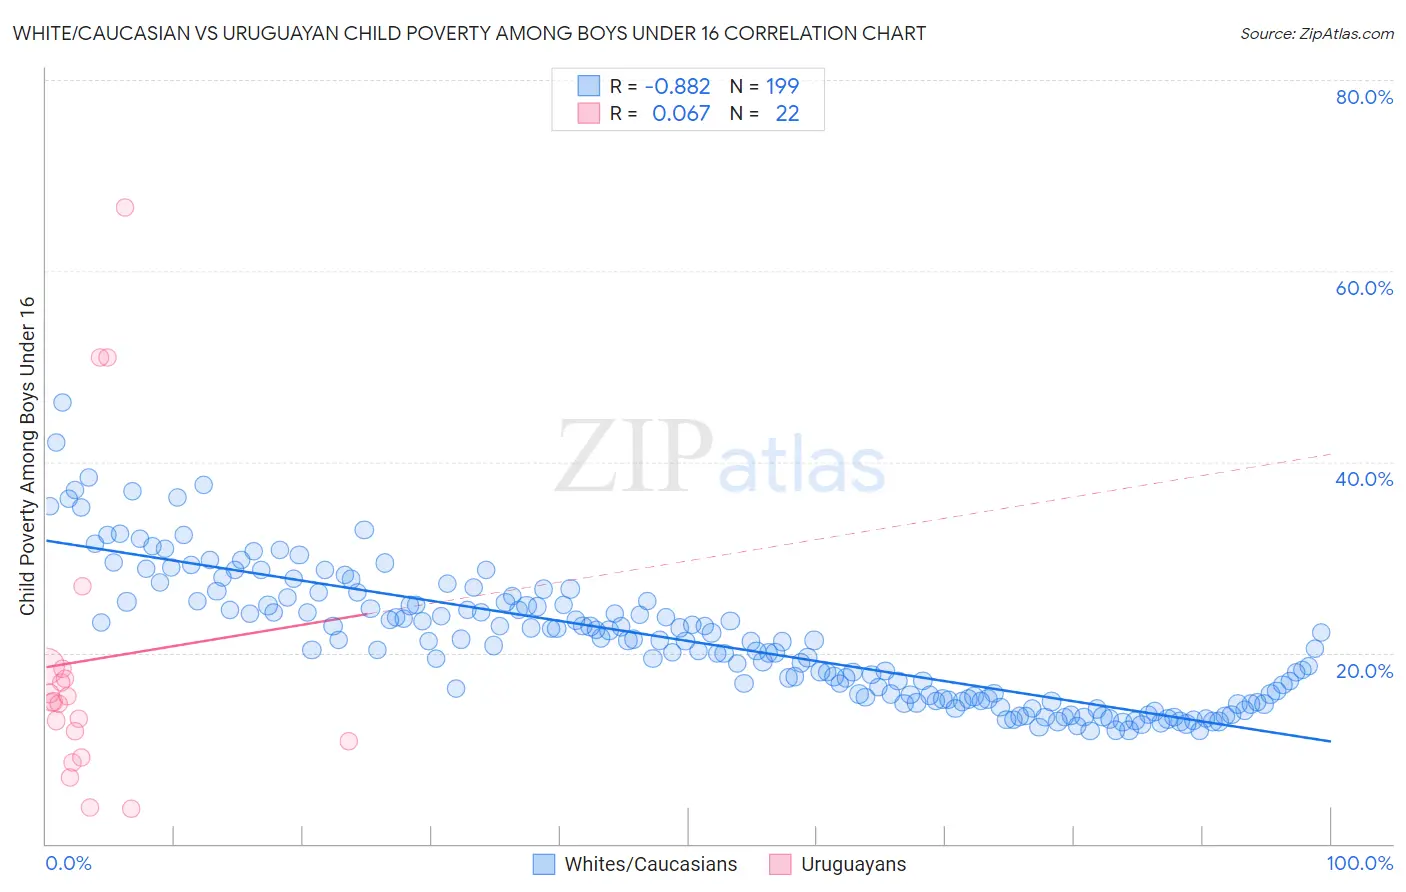
White/Caucasian vs Uruguayan Child Poverty Among Boys Under 16 Correlation Chart
The statistical analysis conducted on geographies consisting of 560,435,427 people shows a very strong negative correlation between the proportion of Whites/Caucasians and poverty level among boys under the age of 16 in the United States with a correlation coefficient (R) of -0.882 and weighted average of 16.5%. Similarly, the statistical analysis conducted on geographies consisting of 143,820,486 people shows a slight positive correlation between the proportion of Uruguayans and poverty level among boys under the age of 16 in the United States with a correlation coefficient (R) of 0.067 and weighted average of 16.4%, a difference of 0.20%.
Child Poverty Among Boys Under 16 Correlation Summary
| Measurement | White/Caucasian | Uruguayan |
| Minimum | 11.8% | 3.7% |
| Maximum | 46.2% | 66.7% |
| Range | 34.4% | 63.0% |
| Mean | 21.3% | 19.2% |
| Median | 21.2% | 14.9% |
| Interquartile 25% (IQ1) | 15.1% | 10.7% |
| Interquartile 75% (IQ3) | 25.3% | 18.3% |
| Interquartile Range (IQR) | 10.2% | 7.6% |
| Standard Deviation (Sample) | 6.9% | 16.2% |
| Standard Deviation (Population) | 6.9% | 15.8% |
Demographics Similar to Whites/Caucasians and Uruguayans by Child Poverty Among Boys Under 16
In terms of child poverty among boys under 16, the demographic groups most similar to Whites/Caucasians are Ethiopian (16.5%, a difference of 0.040%), Scotch-Irish (16.5%, a difference of 0.080%), Immigrants from Syria (16.5%, a difference of 0.090%), Hungarian (16.5%, a difference of 0.10%), and Tsimshian (16.4%, a difference of 0.25%). Similarly, the demographic groups most similar to Uruguayans are Tsimshian (16.4%, a difference of 0.060%), Immigrants from Colombia (16.4%, a difference of 0.090%), Immigrants from Syria (16.5%, a difference of 0.11%), Immigrants from Ethiopia (16.4%, a difference of 0.14%), and Immigrants from Bosnia and Herzegovina (16.4%, a difference of 0.19%).
| Demographics | Rating | Rank | Child Poverty Among Boys Under 16 |
| Colombians | 65.2 /100 | #165 | Good 16.1% |
| Immigrants | Germany | 63.6 /100 | #166 | Good 16.2% |
| Afghans | 55.4 /100 | #167 | Average 16.3% |
| South Americans | 55.3 /100 | #168 | Average 16.3% |
| Immigrants | Saudi Arabia | 53.6 /100 | #169 | Average 16.4% |
| Immigrants | Bosnia and Herzegovina | 51.7 /100 | #170 | Average 16.4% |
| Immigrants | Ethiopia | 51.3 /100 | #171 | Average 16.4% |
| Immigrants | Colombia | 50.8 /100 | #172 | Average 16.4% |
| Tsimshian | 50.5 /100 | #173 | Average 16.4% |
| Uruguayans | 50.0 /100 | #174 | Average 16.4% |
| Immigrants | Syria | 49.0 /100 | #175 | Average 16.5% |
| Whites/Caucasians | 48.2 /100 | #176 | Average 16.5% |
| Ethiopians | 47.8 /100 | #177 | Average 16.5% |
| Scotch-Irish | 47.5 /100 | #178 | Average 16.5% |
| Hungarians | 47.3 /100 | #179 | Average 16.5% |
| Hawaiians | 45.5 /100 | #180 | Average 16.5% |
| South American Indians | 44.3 /100 | #181 | Average 16.5% |
| Lebanese | 43.3 /100 | #182 | Average 16.6% |
| Kenyans | 41.0 /100 | #183 | Average 16.6% |
| Celtics | 40.6 /100 | #184 | Average 16.6% |
| Immigrants | Western Asia | 40.4 /100 | #185 | Average 16.6% |