White/Caucasian vs Haitian Single Father Poverty
COMPARE
White/Caucasian
Haitian
Single Father Poverty
Single Father Poverty Comparison
Whites/Caucasians
Haitians
18.4%
SINGLE FATHER POVERTY
0.0/ 100
METRIC RATING
299th/ 347
METRIC RANK
17.3%
SINGLE FATHER POVERTY
0.3/ 100
METRIC RATING
267th/ 347
METRIC RANK
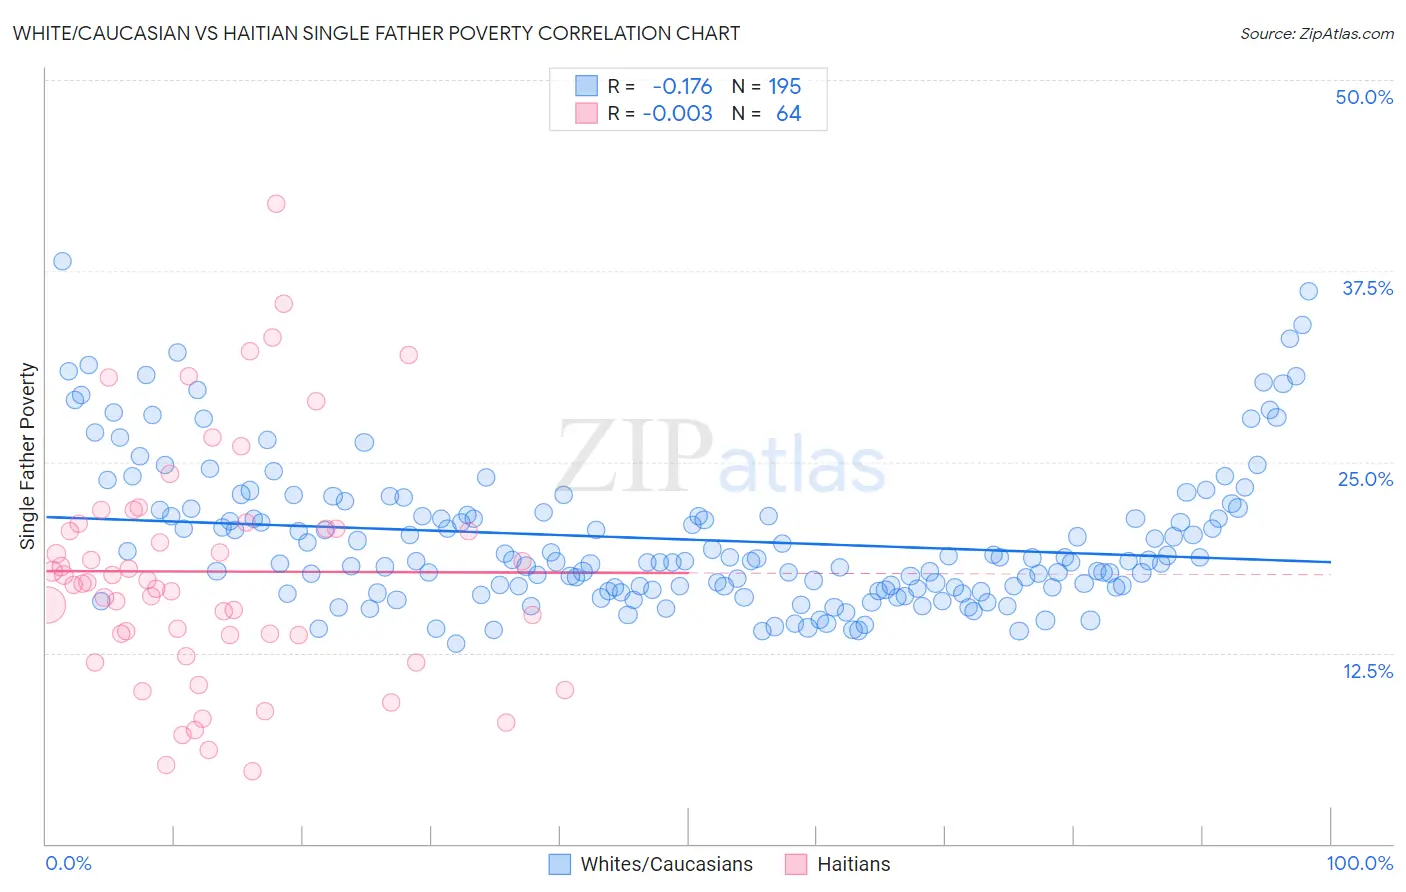
White/Caucasian vs Haitian Single Father Poverty Correlation Chart
The statistical analysis conducted on geographies consisting of 414,032,364 people shows a poor negative correlation between the proportion of Whites/Caucasians and poverty level among single fathers in the United States with a correlation coefficient (R) of -0.176 and weighted average of 18.4%. Similarly, the statistical analysis conducted on geographies consisting of 238,861,302 people shows no correlation between the proportion of Haitians and poverty level among single fathers in the United States with a correlation coefficient (R) of -0.003 and weighted average of 17.3%, a difference of 5.9%.
Single Father Poverty Correlation Summary
| Measurement | White/Caucasian | Haitian |
| Minimum | 13.1% | 4.7% |
| Maximum | 38.1% | 41.9% |
| Range | 25.0% | 37.1% |
| Mean | 19.9% | 17.8% |
| Median | 18.5% | 17.1% |
| Interquartile 25% (IQ1) | 16.7% | 13.7% |
| Interquartile 75% (IQ3) | 21.7% | 20.8% |
| Interquartile Range (IQR) | 5.0% | 7.1% |
| Standard Deviation (Sample) | 4.7% | 7.7% |
| Standard Deviation (Population) | 4.7% | 7.6% |
Similar Demographics by Single Father Poverty
Demographics Similar to Whites/Caucasians by Single Father Poverty
In terms of single father poverty, the demographic groups most similar to Whites/Caucasians are African (18.3%, a difference of 0.21%), Immigrants from Dominican Republic (18.4%, a difference of 0.32%), Hungarian (18.5%, a difference of 0.53%), Comanche (18.5%, a difference of 0.64%), and Celtic (18.5%, a difference of 0.68%).
| Demographics | Rating | Rank | Single Father Poverty |
| Immigrants | Bahamas | 0.0 /100 | #292 | Tragic 18.1% |
| Alaska Natives | 0.0 /100 | #293 | Tragic 18.1% |
| U.S. Virgin Islanders | 0.0 /100 | #294 | Tragic 18.1% |
| Yakama | 0.0 /100 | #295 | Tragic 18.1% |
| Seminole | 0.0 /100 | #296 | Tragic 18.1% |
| French | 0.0 /100 | #297 | Tragic 18.2% |
| Africans | 0.0 /100 | #298 | Tragic 18.3% |
| Whites/Caucasians | 0.0 /100 | #299 | Tragic 18.4% |
| Immigrants | Dominican Republic | 0.0 /100 | #300 | Tragic 18.4% |
| Hungarians | 0.0 /100 | #301 | Tragic 18.5% |
| Comanche | 0.0 /100 | #302 | Tragic 18.5% |
| Celtics | 0.0 /100 | #303 | Tragic 18.5% |
| Ute | 0.0 /100 | #304 | Tragic 18.5% |
| Blackfeet | 0.0 /100 | #305 | Tragic 18.5% |
| Scotch-Irish | 0.0 /100 | #306 | Tragic 18.6% |
Demographics Similar to Haitians by Single Father Poverty
In terms of single father poverty, the demographic groups most similar to Haitians are Jamaican (17.3%, a difference of 0.040%), Polish (17.3%, a difference of 0.090%), Slovene (17.3%, a difference of 0.10%), Immigrants from Caribbean (17.4%, a difference of 0.10%), and Slavic (17.4%, a difference of 0.17%).
| Demographics | Rating | Rank | Single Father Poverty |
| Spaniards | 0.6 /100 | #260 | Tragic 17.2% |
| Swiss | 0.5 /100 | #261 | Tragic 17.3% |
| Immigrants | Zaire | 0.4 /100 | #262 | Tragic 17.3% |
| Lithuanians | 0.4 /100 | #263 | Tragic 17.3% |
| Slovenes | 0.3 /100 | #264 | Tragic 17.3% |
| Poles | 0.3 /100 | #265 | Tragic 17.3% |
| Jamaicans | 0.3 /100 | #266 | Tragic 17.3% |
| Haitians | 0.3 /100 | #267 | Tragic 17.3% |
| Immigrants | Caribbean | 0.3 /100 | #268 | Tragic 17.4% |
| Slavs | 0.3 /100 | #269 | Tragic 17.4% |
| Indonesians | 0.2 /100 | #270 | Tragic 17.4% |
| French American Indians | 0.2 /100 | #271 | Tragic 17.4% |
| Barbadians | 0.1 /100 | #272 | Tragic 17.5% |
| Italians | 0.1 /100 | #273 | Tragic 17.5% |
| Macedonians | 0.1 /100 | #274 | Tragic 17.7% |