West Indian vs Immigrants from Sri Lanka Poverty
COMPARE
West Indian
Immigrants from Sri Lanka
Poverty
Poverty Comparison
West Indians
Immigrants from Sri Lanka
15.0%
POVERTY
0.0/ 100
METRIC RATING
284th/ 347
METRIC RANK
11.2%
POVERTY
97.9/ 100
METRIC RATING
60th/ 347
METRIC RANK
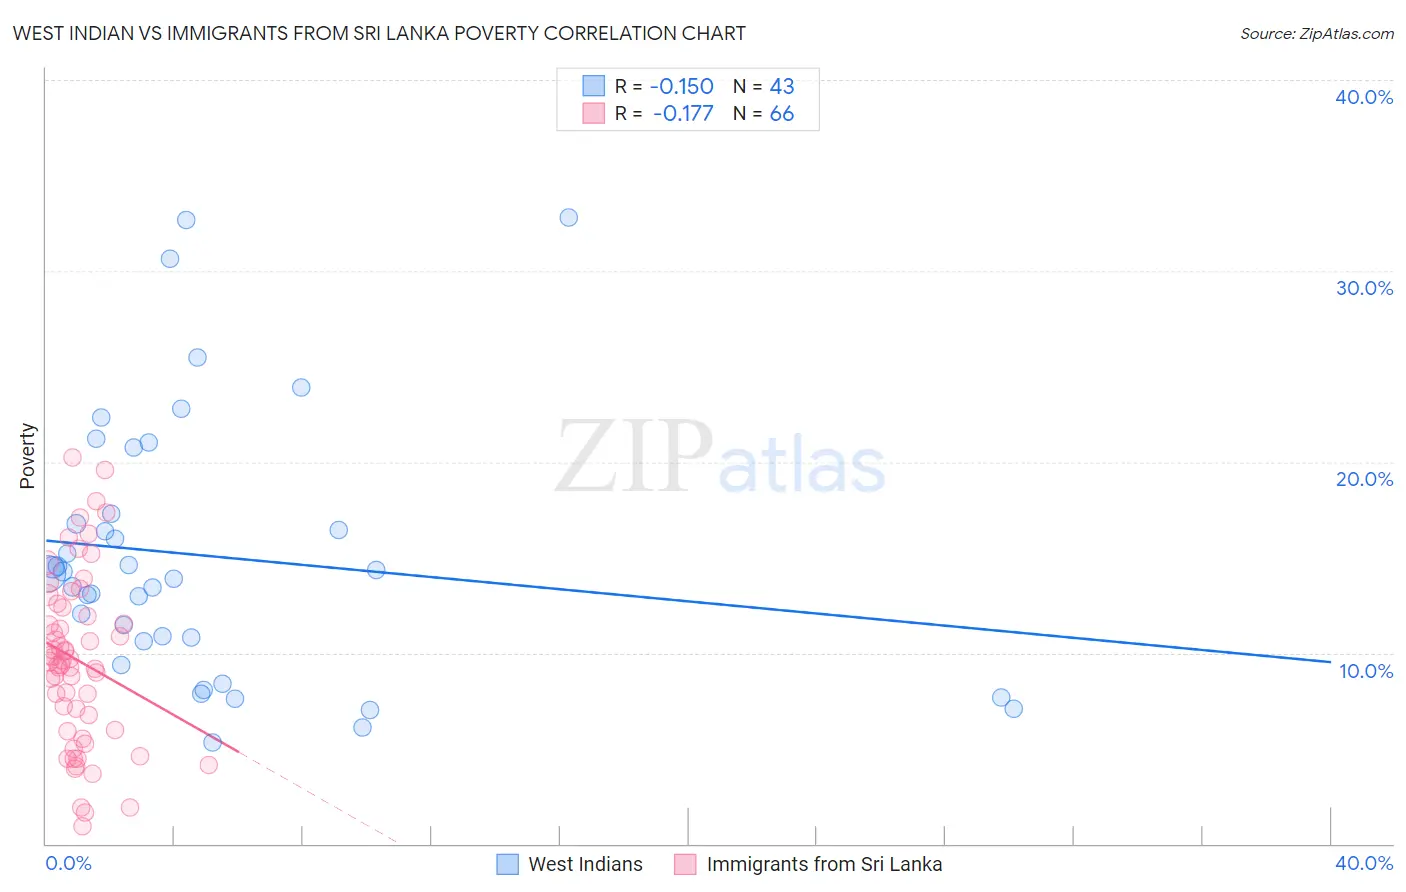
West Indian vs Immigrants from Sri Lanka Poverty Correlation Chart
The statistical analysis conducted on geographies consisting of 253,897,912 people shows a poor negative correlation between the proportion of West Indians and poverty level in the United States with a correlation coefficient (R) of -0.150 and weighted average of 15.0%. Similarly, the statistical analysis conducted on geographies consisting of 149,683,532 people shows a poor negative correlation between the proportion of Immigrants from Sri Lanka and poverty level in the United States with a correlation coefficient (R) of -0.177 and weighted average of 11.2%, a difference of 34.2%.
Poverty Correlation Summary
| Measurement | West Indian | Immigrants from Sri Lanka |
| Minimum | 5.3% | 0.89% |
| Maximum | 32.8% | 20.2% |
| Range | 27.5% | 19.3% |
| Mean | 15.1% | 9.6% |
| Median | 14.1% | 9.6% |
| Interquartile 25% (IQ1) | 10.6% | 6.0% |
| Interquartile 75% (IQ3) | 17.3% | 12.4% |
| Interquartile Range (IQR) | 6.7% | 6.4% |
| Standard Deviation (Sample) | 6.9% | 4.5% |
| Standard Deviation (Population) | 6.8% | 4.4% |
Similar Demographics by Poverty
Demographics Similar to West Indians by Poverty
In terms of poverty, the demographic groups most similar to West Indians are Vietnamese (15.0%, a difference of 0.050%), Immigrants from Haiti (15.0%, a difference of 0.10%), Comanche (15.0%, a difference of 0.23%), Immigrants from Latin America (15.0%, a difference of 0.32%), and Inupiat (15.1%, a difference of 0.53%).
| Demographics | Rating | Rank | Poverty |
| Bangladeshis | 0.0 /100 | #277 | Tragic 14.8% |
| Belizeans | 0.0 /100 | #278 | Tragic 14.8% |
| Immigrants | St. Vincent and the Grenadines | 0.0 /100 | #279 | Tragic 14.9% |
| Haitians | 0.0 /100 | #280 | Tragic 14.9% |
| Immigrants | Barbados | 0.0 /100 | #281 | Tragic 14.9% |
| Comanche | 0.0 /100 | #282 | Tragic 15.0% |
| Immigrants | Haiti | 0.0 /100 | #283 | Tragic 15.0% |
| West Indians | 0.0 /100 | #284 | Tragic 15.0% |
| Vietnamese | 0.0 /100 | #285 | Tragic 15.0% |
| Immigrants | Latin America | 0.0 /100 | #286 | Tragic 15.0% |
| Inupiat | 0.0 /100 | #287 | Tragic 15.1% |
| Yaqui | 0.0 /100 | #288 | Tragic 15.1% |
| Immigrants | Belize | 0.0 /100 | #289 | Tragic 15.1% |
| Mexicans | 0.0 /100 | #290 | Tragic 15.1% |
| Immigrants | Cabo Verde | 0.0 /100 | #291 | Tragic 15.1% |
Demographics Similar to Immigrants from Sri Lanka by Poverty
In terms of poverty, the demographic groups most similar to Immigrants from Sri Lanka are Immigrants from Italy (11.2%, a difference of 0.060%), Austrian (11.2%, a difference of 0.10%), Ukrainian (11.2%, a difference of 0.10%), Immigrants from Europe (11.2%, a difference of 0.16%), and German (11.1%, a difference of 0.31%).
| Demographics | Rating | Rank | Poverty |
| Immigrants | Austria | 98.6 /100 | #53 | Exceptional 11.1% |
| Immigrants | Bulgaria | 98.5 /100 | #54 | Exceptional 11.1% |
| Immigrants | Serbia | 98.5 /100 | #55 | Exceptional 11.1% |
| Estonians | 98.2 /100 | #56 | Exceptional 11.1% |
| Scandinavians | 98.2 /100 | #57 | Exceptional 11.1% |
| Germans | 98.1 /100 | #58 | Exceptional 11.1% |
| Immigrants | Europe | 98.0 /100 | #59 | Exceptional 11.2% |
| Immigrants | Sri Lanka | 97.9 /100 | #60 | Exceptional 11.2% |
| Immigrants | Italy | 97.9 /100 | #61 | Exceptional 11.2% |
| Austrians | 97.8 /100 | #62 | Exceptional 11.2% |
| Ukrainians | 97.8 /100 | #63 | Exceptional 11.2% |
| Swiss | 97.7 /100 | #64 | Exceptional 11.2% |
| Immigrants | Asia | 97.5 /100 | #65 | Exceptional 11.2% |
| Immigrants | Netherlands | 97.5 /100 | #66 | Exceptional 11.2% |
| Immigrants | Australia | 97.4 /100 | #67 | Exceptional 11.2% |