West Indian vs Immigrants from Jamaica Family Poverty
COMPARE
West Indian
Immigrants from Jamaica
Family Poverty
Family Poverty Comparison
West Indians
Immigrants from Jamaica
11.5%
FAMILY POVERTY
0.0/ 100
METRIC RATING
290th/ 347
METRIC RANK
11.2%
FAMILY POVERTY
0.1/ 100
METRIC RATING
272nd/ 347
METRIC RANK
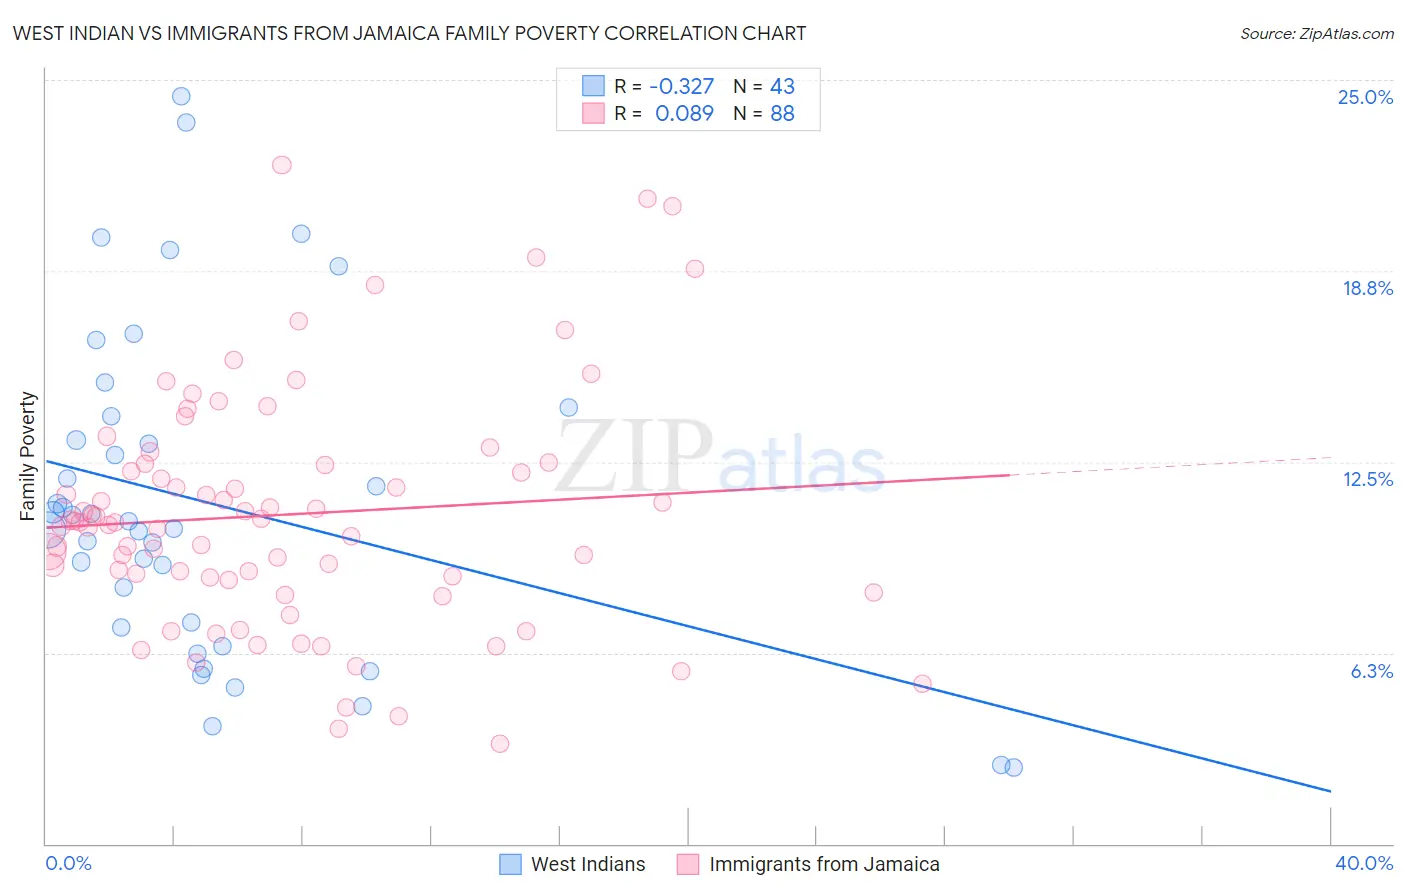
West Indian vs Immigrants from Jamaica Family Poverty Correlation Chart
The statistical analysis conducted on geographies consisting of 253,611,735 people shows a mild negative correlation between the proportion of West Indians and poverty level among families in the United States with a correlation coefficient (R) of -0.327 and weighted average of 11.5%. Similarly, the statistical analysis conducted on geographies consisting of 301,099,868 people shows a slight positive correlation between the proportion of Immigrants from Jamaica and poverty level among families in the United States with a correlation coefficient (R) of 0.089 and weighted average of 11.2%, a difference of 3.3%.
Family Poverty Correlation Summary
| Measurement | West Indian | Immigrants from Jamaica |
| Minimum | 2.5% | 3.3% |
| Maximum | 24.5% | 22.2% |
| Range | 22.0% | 19.0% |
| Mean | 11.2% | 10.8% |
| Median | 10.5% | 10.5% |
| Interquartile 25% (IQ1) | 7.1% | 8.7% |
| Interquartile 75% (IQ3) | 14.0% | 12.4% |
| Interquartile Range (IQR) | 6.9% | 3.7% |
| Standard Deviation (Sample) | 5.3% | 3.9% |
| Standard Deviation (Population) | 5.3% | 3.9% |
Demographics Similar to West Indians and Immigrants from Jamaica by Family Poverty
In terms of family poverty, the demographic groups most similar to West Indians are Immigrants from Barbados (11.5%, a difference of 0.010%), Immigrants from Belize (11.5%, a difference of 0.060%), Haitian (11.5%, a difference of 0.060%), Vietnamese (11.5%, a difference of 0.25%), and Senegalese (11.5%, a difference of 0.52%). Similarly, the demographic groups most similar to Immigrants from Jamaica are Immigrants from Bahamas (11.1%, a difference of 0.10%), Somali (11.2%, a difference of 0.51%), Spanish American (11.2%, a difference of 0.60%), Central American (11.2%, a difference of 0.65%), and Immigrants from Guyana (11.2%, a difference of 0.67%).
| Demographics | Rating | Rank | Family Poverty |
| Immigrants | Bahamas | 0.1 /100 | #271 | Tragic 11.1% |
| Immigrants | Jamaica | 0.1 /100 | #272 | Tragic 11.2% |
| Somalis | 0.1 /100 | #273 | Tragic 11.2% |
| Spanish Americans | 0.1 /100 | #274 | Tragic 11.2% |
| Central Americans | 0.1 /100 | #275 | Tragic 11.2% |
| Immigrants | Guyana | 0.1 /100 | #276 | Tragic 11.2% |
| Chippewa | 0.1 /100 | #277 | Tragic 11.2% |
| Guyanese | 0.1 /100 | #278 | Tragic 11.2% |
| Blackfeet | 0.0 /100 | #279 | Tragic 11.3% |
| Belizeans | 0.0 /100 | #280 | Tragic 11.3% |
| Immigrants | West Indies | 0.0 /100 | #281 | Tragic 11.3% |
| Immigrants | Cuba | 0.0 /100 | #282 | Tragic 11.3% |
| Indonesians | 0.0 /100 | #283 | Tragic 11.3% |
| Yaqui | 0.0 /100 | #284 | Tragic 11.3% |
| Barbadians | 0.0 /100 | #285 | Tragic 11.3% |
| Senegalese | 0.0 /100 | #286 | Tragic 11.5% |
| Vietnamese | 0.0 /100 | #287 | Tragic 11.5% |
| Immigrants | Belize | 0.0 /100 | #288 | Tragic 11.5% |
| Immigrants | Barbados | 0.0 /100 | #289 | Tragic 11.5% |
| West Indians | 0.0 /100 | #290 | Tragic 11.5% |
| Haitians | 0.0 /100 | #291 | Tragic 11.5% |