West Indian vs Immigrants from Bangladesh Single Male Poverty
COMPARE
West Indian
Immigrants from Bangladesh
Single Male Poverty
Single Male Poverty Comparison
West Indians
Immigrants from Bangladesh
13.8%
SINGLE MALE POVERTY
0.2/ 100
METRIC RATING
264th/ 347
METRIC RANK
13.0%
SINGLE MALE POVERTY
20.4/ 100
METRIC RATING
203rd/ 347
METRIC RANK
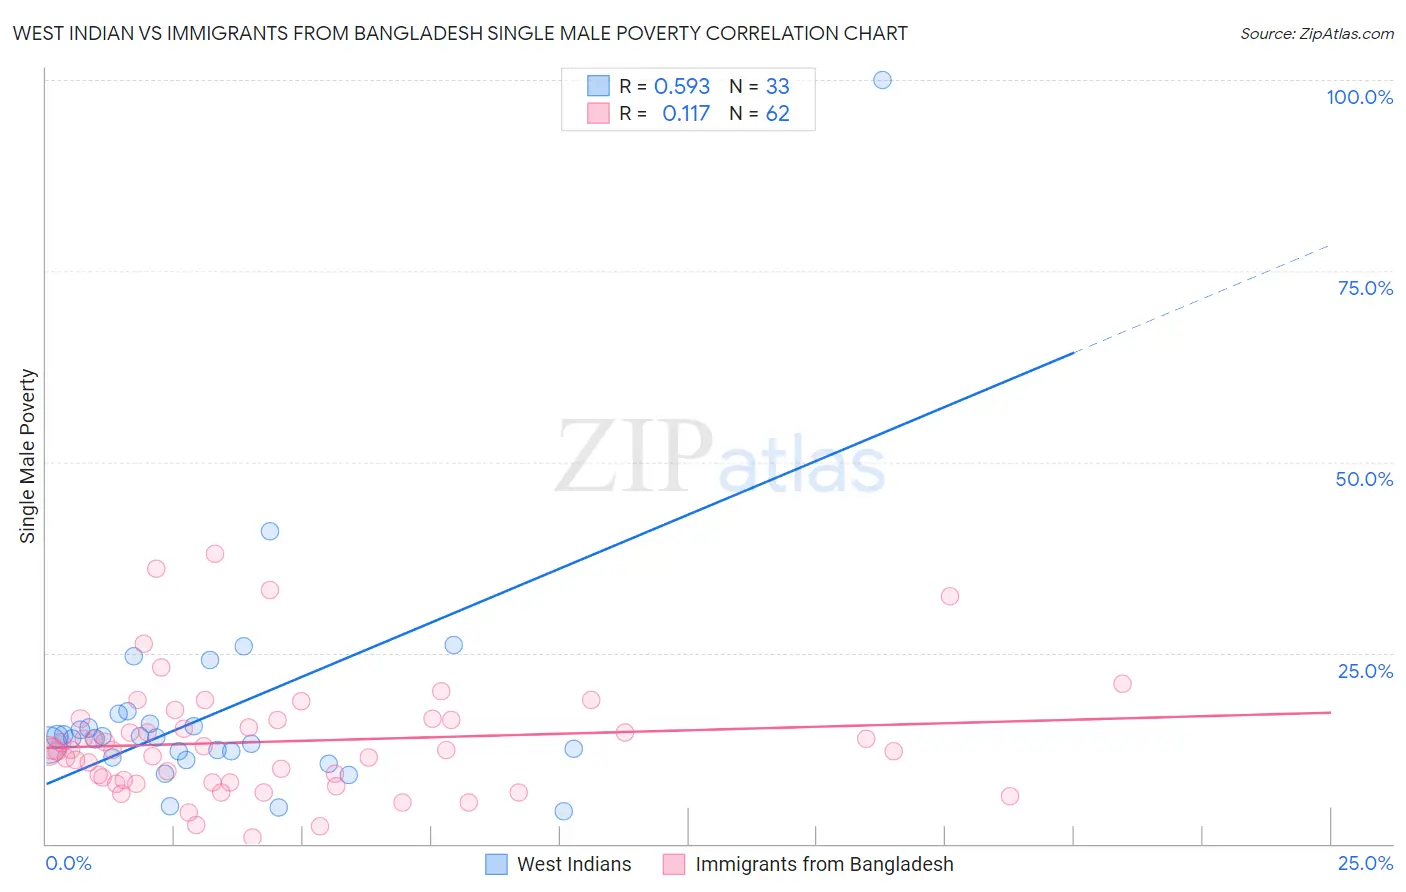
West Indian vs Immigrants from Bangladesh Single Male Poverty Correlation Chart
The statistical analysis conducted on geographies consisting of 236,137,868 people shows a substantial positive correlation between the proportion of West Indians and poverty level among single males in the United States with a correlation coefficient (R) of 0.593 and weighted average of 13.8%. Similarly, the statistical analysis conducted on geographies consisting of 188,106,826 people shows a poor positive correlation between the proportion of Immigrants from Bangladesh and poverty level among single males in the United States with a correlation coefficient (R) of 0.117 and weighted average of 13.0%, a difference of 6.3%.
Single Male Poverty Correlation Summary
| Measurement | West Indian | Immigrants from Bangladesh |
| Minimum | 4.3% | 0.77% |
| Maximum | 100.0% | 38.0% |
| Range | 95.7% | 37.2% |
| Mean | 17.4% | 13.4% |
| Median | 13.9% | 12.2% |
| Interquartile 25% (IQ1) | 11.6% | 8.1% |
| Interquartile 75% (IQ3) | 16.3% | 16.3% |
| Interquartile Range (IQR) | 4.7% | 8.2% |
| Standard Deviation (Sample) | 16.4% | 7.6% |
| Standard Deviation (Population) | 16.2% | 7.6% |
Similar Demographics by Single Male Poverty
Demographics Similar to West Indians by Single Male Poverty
In terms of single male poverty, the demographic groups most similar to West Indians are Immigrants from Congo (13.9%, a difference of 0.16%), Cape Verdean (13.8%, a difference of 0.19%), Fijian (13.8%, a difference of 0.31%), Immigrants from Cabo Verde (13.9%, a difference of 0.47%), and Hungarian (13.8%, a difference of 0.48%).
| Demographics | Rating | Rank | Single Male Poverty |
| Immigrants | Central America | 0.3 /100 | #257 | Tragic 13.8% |
| Immigrants | Guatemala | 0.3 /100 | #258 | Tragic 13.8% |
| Guatemalans | 0.3 /100 | #259 | Tragic 13.8% |
| Swiss | 0.3 /100 | #260 | Tragic 13.8% |
| Hungarians | 0.3 /100 | #261 | Tragic 13.8% |
| Fijians | 0.3 /100 | #262 | Tragic 13.8% |
| Cape Verdeans | 0.2 /100 | #263 | Tragic 13.8% |
| West Indians | 0.2 /100 | #264 | Tragic 13.8% |
| Immigrants | Congo | 0.2 /100 | #265 | Tragic 13.9% |
| Immigrants | Cabo Verde | 0.1 /100 | #266 | Tragic 13.9% |
| Germans | 0.1 /100 | #267 | Tragic 13.9% |
| Immigrants | Mexico | 0.1 /100 | #268 | Tragic 13.9% |
| Scottish | 0.1 /100 | #269 | Tragic 14.0% |
| Immigrants | Saudi Arabia | 0.1 /100 | #270 | Tragic 14.0% |
| Irish | 0.1 /100 | #271 | Tragic 14.0% |
Demographics Similar to Immigrants from Bangladesh by Single Male Poverty
In terms of single male poverty, the demographic groups most similar to Immigrants from Bangladesh are Estonian (13.0%, a difference of 0.0%), Basque (13.0%, a difference of 0.030%), Trinidadian and Tobagonian (13.0%, a difference of 0.090%), Polish (13.0%, a difference of 0.090%), and Slovene (13.0%, a difference of 0.10%).
| Demographics | Rating | Rank | Single Male Poverty |
| Immigrants | Grenada | 23.1 /100 | #196 | Fair 13.0% |
| Immigrants | Laos | 23.1 /100 | #197 | Fair 13.0% |
| Lithuanians | 22.1 /100 | #198 | Fair 13.0% |
| Immigrants | Norway | 21.8 /100 | #199 | Fair 13.0% |
| Slovenes | 21.6 /100 | #200 | Fair 13.0% |
| Trinidadians and Tobagonians | 21.4 /100 | #201 | Fair 13.0% |
| Basques | 20.7 /100 | #202 | Fair 13.0% |
| Immigrants | Bangladesh | 20.4 /100 | #203 | Fair 13.0% |
| Estonians | 20.3 /100 | #204 | Fair 13.0% |
| Poles | 19.3 /100 | #205 | Poor 13.0% |
| Northern Europeans | 18.9 /100 | #206 | Poor 13.0% |
| Sudanese | 17.7 /100 | #207 | Poor 13.1% |
| Immigrants | Western Africa | 17.6 /100 | #208 | Poor 13.1% |
| Mexican American Indians | 17.5 /100 | #209 | Poor 13.1% |
| Immigrants | Haiti | 16.8 /100 | #210 | Poor 13.1% |