Vietnamese vs Colombian Child Poverty Among Boys Under 16

COMPARE

Vietnamese
Race
Ancestry
AfghanAfricanAlaska NativeAlaskan AthabascanAlbanianAleutAlsatianAmericanApacheArabArapahoArgentineanArmenianAssyrian/Chaldean/SyriacAustralianAustrianBahamianBangladeshiBarbadianBasqueBelgianBelizeanBermudanBhutaneseBlackfeetBolivianBrazilianBritishBritish West IndianBulgarianBurmeseCajunCambodianCanadianCape VerdeanCarpatho RusynCelticCentral AmericanCentral American IndianCherokeeCheyenneChickasawChileanChineseChippewaChoctawColvilleComancheCosta RicanCreeCreekCroatianCrowCubanCypriotCzechCzechoslovakianDanishDelawareDominicanDutchDutch West IndianEastern EuropeanEcuadorianEgyptianEnglishEstonianEthiopianEuropeanFijianFilipinoFinnishFrenchFrench American IndianFrench CanadianGermanGerman RussianGhanaianGreekGuamanian/ChamorroGuatemalanGuyaneseHaitianHmongHonduranHopiHoumaHungarianIcelanderIndian (Asian)IndonesianInupiatIranianIraqiIrishIroquoisIsraeliItalianJamaicanJapaneseJordanianKenyanKiowaKoreanLaotianLatvianLebaneseLiberianLithuanianLumbeeLuxembourgerMacedonianMalaysianMalteseMarshalleseMenomineeMexicanMexican American IndianMongolianMoroccanNative HawaiianNavajoNepaleseNew ZealanderNicaraguanNigerianNorthern EuropeanNorwegianOkinawanOsageOttawaPaiutePakistaniPalestinianPanamanianParaguayanPennsylvania GermanPeruvianPimaPolishPortuguesePotawatomiPuebloPuerto RicanPuget Sound SalishRomanianRussianSalvadoranSamoanScandinavianScotch-IrishScottishSeminoleSenegaleseSerbianShoshoneSierra LeoneanSiouxSlavicSlovakSloveneSomaliSouth AfricanSouth AmericanSouth American IndianSoviet UnionSpaniardSpanishSpanish AmericanSpanish American IndianSri LankanSubsaharan AfricanSudaneseSwedishSwissSyrianTaiwaneseThaiTlingit-HaidaTohono O'OdhamTonganTrinidadian and TobagonianTsimshianTurkishU.S. Virgin IslanderUgandanUkrainianUruguayanUteVenezuelanVietnameseWelshWest IndianYakamaYaquiYugoslavianYumanYup'ikZimbabwean
Immigration
NonimmigrantsImmigrantsAfghanistanAfricaAlbaniaArgentinaArmeniaAsiaAustraliaAustriaBahamasBangladeshBarbadosBelarusBelgiumBelizeBoliviaBosnia and HerzegovinaBrazilBulgariaBurma/MyanmarCabo VerdeCambodiaCameroonCanadaCaribbeanCentral AmericaChileChinaColombiaCongoCosta RicaCroatiaCubaCzechoslovakiaDenmarkDominicaDominican RepublicEastern AfricaEastern AsiaEastern EuropeEcuadorEgyptEl SalvadorEnglandEritreaEthiopiaEuropeFijiFranceGermanyGhanaGreeceGrenadaGuatemalaGuyanaHaitiHondurasHong KongHungaryIndiaIndonesiaIranIraqIrelandIsraelItalyJamaicaJapanJordanKazakhstanKenyaKoreaKuwaitLaosLatin AmericaLatviaLebanonLiberiaLithuaniaMalaysiaMexicoMicronesiaMiddle AfricaMoldovaMoroccoNepalNetherlandsNicaraguaNigeriaNorth AmericaNorth MacedoniaNorthern AfricaNorthern EuropeNorwayOceaniaPakistanPanamaPeruPhilippinesPolandPortugalRomaniaRussiaSaudi ArabiaScotlandSenegalSerbiaSierra LeoneSingaporeSomaliaSouth AfricaSouth AmericaSouth Central AsiaSouth Eastern AsiaSouthern EuropeSpainSri LankaSt. Vincent and the GrenadinesSudanSwedenSwitzerlandSyriaTaiwanThailandTrinidad and TobagoTurkeyUgandaUkraineUruguayUzbekistanVenezuelaVietnamWest IndiesWestern AfricaWestern AsiaWestern EuropeYemenZaireZimbabweAzores
Colombian
Race
Ancestry
AfghanAfricanAlaska NativeAlaskan AthabascanAlbanianAleutAlsatianAmericanApacheArabArapahoArgentineanArmenianAssyrian/Chaldean/SyriacAustralianAustrianBahamianBangladeshiBarbadianBasqueBelgianBelizeanBermudanBhutaneseBlackfeetBolivianBrazilianBritishBritish West IndianBulgarianBurmeseCajunCambodianCanadianCape VerdeanCarpatho RusynCelticCentral AmericanCentral American IndianCherokeeCheyenneChickasawChileanChineseChippewaChoctawColombianColvilleComancheCosta RicanCreeCreekCroatianCrowCubanCypriotCzechCzechoslovakianDanishDelawareDominicanDutchDutch West IndianEastern EuropeanEcuadorianEgyptianEnglishEstonianEthiopianEuropeanFijianFilipinoFinnishFrenchFrench American IndianFrench CanadianGermanGerman RussianGhanaianGreekGuamanian/ChamorroGuatemalanGuyaneseHaitianHmongHonduranHopiHoumaHungarianIcelanderIndian (Asian)IndonesianInupiatIranianIraqiIrishIroquoisIsraeliItalianJamaicanJapaneseJordanianKenyanKiowaKoreanLaotianLatvianLebaneseLiberianLithuanianLumbeeLuxembourgerMacedonianMalaysianMalteseMarshalleseMenomineeMexicanMexican American IndianMongolianMoroccanNative HawaiianNavajoNepaleseNew ZealanderNicaraguanNigerianNorthern EuropeanNorwegianOkinawanOsageOttawaPaiutePakistaniPalestinianPanamanianParaguayanPennsylvania GermanPeruvianPimaPolishPortuguesePotawatomiPuebloPuerto RicanPuget Sound SalishRomanianRussianSalvadoranSamoanScandinavianScotch-IrishScottishSeminoleSenegaleseSerbianShoshoneSierra LeoneanSiouxSlavicSlovakSloveneSomaliSouth AfricanSouth AmericanSouth American IndianSoviet UnionSpaniardSpanishSpanish AmericanSpanish American IndianSri LankanSubsaharan AfricanSudaneseSwedishSwissSyrianTaiwaneseThaiTlingit-HaidaTohono O'OdhamTonganTrinidadian and TobagonianTsimshianTurkishU.S. Virgin IslanderUgandanUkrainianUruguayanUteVenezuelanWelshWest IndianYakamaYaquiYugoslavianYumanYup'ikZimbabwean
Immigration
NonimmigrantsImmigrantsAfghanistanAfricaAlbaniaArgentinaArmeniaAsiaAustraliaAustriaBahamasBangladeshBarbadosBelarusBelgiumBelizeBoliviaBosnia and HerzegovinaBrazilBulgariaBurma/MyanmarCabo VerdeCambodiaCameroonCanadaCaribbeanCentral AmericaChileChinaColombiaCongoCosta RicaCroatiaCubaCzechoslovakiaDenmarkDominicaDominican RepublicEastern AfricaEastern AsiaEastern EuropeEcuadorEgyptEl SalvadorEnglandEritreaEthiopiaEuropeFijiFranceGermanyGhanaGreeceGrenadaGuatemalaGuyanaHaitiHondurasHong KongHungaryIndiaIndonesiaIranIraqIrelandIsraelItalyJamaicaJapanJordanKazakhstanKenyaKoreaKuwaitLaosLatin AmericaLatviaLebanonLiberiaLithuaniaMalaysiaMexicoMicronesiaMiddle AfricaMoldovaMoroccoNepalNetherlandsNicaraguaNigeriaNorth AmericaNorth MacedoniaNorthern AfricaNorthern EuropeNorwayOceaniaPakistanPanamaPeruPhilippinesPolandPortugalRomaniaRussiaSaudi ArabiaScotlandSenegalSerbiaSierra LeoneSingaporeSomaliaSouth AfricaSouth AmericaSouth Central AsiaSouth Eastern AsiaSouthern EuropeSpainSri LankaSt. Vincent and the GrenadinesSudanSwedenSwitzerlandSyriaTaiwanThailandTrinidad and TobagoTurkeyUgandaUkraineUruguayUzbekistanVenezuelaVietnamWest IndiesWestern AfricaWestern AsiaWestern EuropeYemenZaireZimbabweAzores
Child Poverty Among Boys Under 16
Income
Poverty
Unemployment
Labor Participation
Family Structure
Vehicle Availability
Education Level
Disability

Child Poverty Among Boys Under 16 Comparison

Vietnamese

Colombians

Tragic
Good
19.6%
CHILD POVERTY AMONG BOYS UNDER 16
0.1/ 100
METRIC RATING
267th/ 347
METRIC RANK
16.1%
CHILD POVERTY AMONG BOYS UNDER 16
65.2/ 100
METRIC RATING
165th/ 347
METRIC RANK

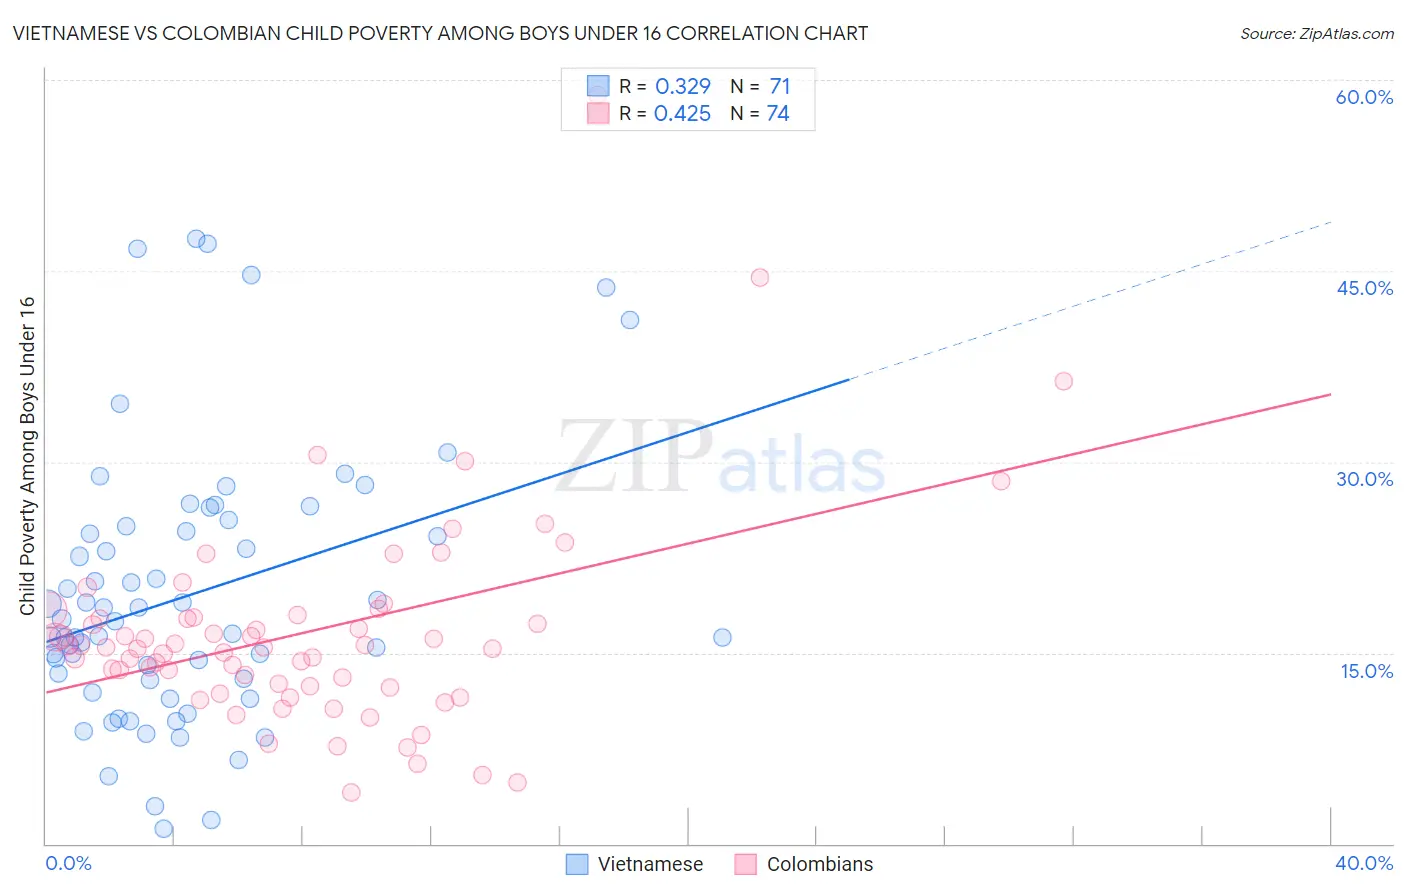
Vietnamese vs Colombian Child Poverty Among Boys Under 16 Correlation Chart

The statistical analysis conducted on geographies consisting of 169,843,059 people shows a mild positive correlation between the proportion of Vietnamese and poverty level among boys under the age of 16 in the United States with a correlation coefficient (R) of 0.329 and weighted average of 19.6%. Similarly, the statistical analysis conducted on geographies consisting of 412,508,797 people shows a moderate positive correlation between the proportion of Colombians and poverty level among boys under the age of 16 in the United States with a correlation coefficient (R) of 0.425 and weighted average of 16.1%, a difference of 21.4%.
Vietnamese vs Colombian Child Poverty Among Boys Under 16

Child Poverty Among Boys Under 16 Correlation Summary

MeasurementVietnameseColombian
Minimum1.2%4.0%
Maximum47.5%58.8%
Range46.4%54.7%
Mean19.5%16.6%
Median17.5%15.4%
Interquartile 25% (IQ1)12.9%12.4%
Interquartile 75% (IQ3)25.0%17.7%
Interquartile Range (IQR)12.1%5.3%
Standard Deviation (Sample)10.6%8.3%
Standard Deviation (Population)10.5%8.3%

Similar Demographics by Child Poverty Among Boys Under 16

Demographics Similar to Vietnamese by Child Poverty Among Boys Under 16

In terms of child poverty among boys under 16, the demographic groups most similar to Vietnamese are Immigrants from El Salvador (19.6%, a difference of 0.010%), Guyanese (19.6%, a difference of 0.060%), Spanish American Indian (19.6%, a difference of 0.11%), Iroquois (19.6%, a difference of 0.15%), and Immigrants from Cabo Verde (19.7%, a difference of 0.27%).
DemographicsRating | RankChild Poverty Among Boys Under 16
Shoshone
0.2
/100
|
#260
Tragic
19.4%
Immigrants | Ghana
0.2
/100
|
#261
Tragic
19.4%
Immigrants | Guyana
0.1
/100
|
#262
Tragic
19.5%
Ottawa
0.1
/100
|
#263
Tragic
19.5%
Iroquois
0.1
/100
|
#264
Tragic
19.6%
Guyanese
0.1
/100
|
#265
Tragic
19.6%
Immigrants | El Salvador
0.1
/100
|
#266
Tragic
19.6%
Vietnamese
0.1
/100
|
#267
Tragic
19.6%
Spanish American Indians
0.1
/100
|
#268
Tragic
19.6%
Immigrants | Cabo Verde
0.1
/100
|
#269
Tragic
19.7%
Cherokee
0.1
/100
|
#270
Tragic
19.7%
Chickasaw
0.1
/100
|
#271
Tragic
19.8%
Immigrants | Ecuador
0.1
/100
|
#272
Tragic
19.8%
Belizeans
0.1
/100
|
#273
Tragic
19.9%
Immigrants | Bangladesh
0.0
/100
|
#274
Tragic
19.9%

Demographics Similar to Colombians by Child Poverty Among Boys Under 16

In terms of child poverty among boys under 16, the demographic groups most similar to Colombians are Immigrants from Germany (16.2%, a difference of 0.20%), Immigrants from Albania (16.1%, a difference of 0.35%), Costa Rican (16.1%, a difference of 0.38%), Guamanian/Chamorro (16.1%, a difference of 0.58%), and Immigrants from Oceania (16.0%, a difference of 0.81%).
DemographicsRating | RankChild Poverty Among Boys Under 16
Yugoslavians
75.9
/100
|
#158
Good
15.9%
Immigrants | Chile
74.8
/100
|
#159
Good
15.9%
Immigrants | Northern Africa
71.3
/100
|
#160
Good
16.0%
Immigrants | Oceania
71.3
/100
|
#161
Good
16.0%
Guamanians/Chamorros
69.6
/100
|
#162
Good
16.1%
Costa Ricans
68.1
/100
|
#163
Good
16.1%
Immigrants | Albania
67.9
/100
|
#164
Good
16.1%
Colombians
65.2
/100
|
#165
Good
16.1%
Immigrants | Germany
63.6
/100
|
#166
Good
16.2%
Afghans
55.4
/100
|
#167
Average
16.3%
South Americans
55.3
/100
|
#168
Average
16.3%
Immigrants | Saudi Arabia
53.6
/100
|
#169
Average
16.4%
Immigrants | Bosnia and Herzegovina
51.7
/100
|
#170
Average
16.4%
Immigrants | Ethiopia
51.3
/100
|
#171
Average
16.4%
Immigrants | Colombia
50.8
/100
|
#172
Average
16.4%