Venezuelan vs Pakistani Seniors Poverty Over the Age of 65

COMPARE

Venezuelan
Race
Ancestry
AfghanAfricanAlaska NativeAlaskan AthabascanAlbanianAleutAlsatianAmericanApacheArabArapahoArgentineanArmenianAssyrian/Chaldean/SyriacAustralianAustrianBahamianBangladeshiBarbadianBasqueBelgianBelizeanBermudanBhutaneseBlackfeetBolivianBrazilianBritishBritish West IndianBulgarianBurmeseCajunCambodianCanadianCape VerdeanCarpatho RusynCelticCentral AmericanCentral American IndianCherokeeCheyenneChickasawChileanChineseChippewaChoctawColombianColvilleComancheCosta RicanCreeCreekCroatianCrowCubanCypriotCzechCzechoslovakianDanishDelawareDominicanDutchDutch West IndianEastern EuropeanEcuadorianEgyptianEnglishEstonianEthiopianEuropeanFijianFilipinoFinnishFrenchFrench American IndianFrench CanadianGermanGerman RussianGhanaianGreekGuamanian/ChamorroGuatemalanGuyaneseHaitianHmongHonduranHopiHoumaHungarianIcelanderIndian (Asian)IndonesianInupiatIranianIraqiIrishIroquoisIsraeliItalianJamaicanJapaneseJordanianKenyanKiowaKoreanLaotianLatvianLebaneseLiberianLithuanianLumbeeLuxembourgerMacedonianMalaysianMalteseMarshalleseMenomineeMexicanMexican American IndianMongolianMoroccanNative HawaiianNavajoNepaleseNew ZealanderNicaraguanNigerianNorthern EuropeanNorwegianOkinawanOsageOttawaPaiutePalestinianPanamanianParaguayanPennsylvania GermanPeruvianPimaPolishPortuguesePotawatomiPuebloPuerto RicanPuget Sound SalishRomanianRussianSalvadoranSamoanScandinavianScotch-IrishScottishSeminoleSenegaleseSerbianShoshoneSierra LeoneanSiouxSlavicSlovakSloveneSomaliSouth AfricanSouth AmericanSouth American IndianSoviet UnionSpaniardSpanishSpanish AmericanSpanish American IndianSri LankanSubsaharan AfricanSudaneseSwedishSwissSyrianTaiwaneseThaiTlingit-HaidaTohono O'OdhamTonganTrinidadian and TobagonianTsimshianTurkishU.S. Virgin IslanderUgandanUkrainianUruguayanUteVenezuelanVietnameseWelshWest IndianYakamaYaquiYugoslavianYumanYup'ikZimbabwean
Immigration
NonimmigrantsImmigrantsAfghanistanAfricaAlbaniaArgentinaArmeniaAsiaAustraliaAustriaBahamasBangladeshBarbadosBelarusBelgiumBelizeBoliviaBosnia and HerzegovinaBrazilBulgariaBurma/MyanmarCabo VerdeCambodiaCameroonCanadaCaribbeanCentral AmericaChileChinaColombiaCongoCosta RicaCroatiaCubaCzechoslovakiaDenmarkDominicaDominican RepublicEastern AfricaEastern AsiaEastern EuropeEcuadorEgyptEl SalvadorEnglandEritreaEthiopiaEuropeFijiFranceGermanyGhanaGreeceGrenadaGuatemalaGuyanaHaitiHondurasHong KongHungaryIndiaIndonesiaIranIraqIrelandIsraelItalyJamaicaJapanJordanKazakhstanKenyaKoreaKuwaitLaosLatin AmericaLatviaLebanonLiberiaLithuaniaMalaysiaMexicoMicronesiaMiddle AfricaMoldovaMoroccoNepalNetherlandsNicaraguaNigeriaNorth AmericaNorth MacedoniaNorthern AfricaNorthern EuropeNorwayOceaniaPakistanPanamaPeruPhilippinesPolandPortugalRomaniaRussiaSaudi ArabiaScotlandSenegalSerbiaSierra LeoneSingaporeSomaliaSouth AfricaSouth AmericaSouth Central AsiaSouth Eastern AsiaSouthern EuropeSpainSri LankaSt. Vincent and the GrenadinesSudanSwedenSwitzerlandSyriaTaiwanThailandTrinidad and TobagoTurkeyUgandaUkraineUruguayUzbekistanVenezuelaVietnamWest IndiesWestern AfricaWestern AsiaWestern EuropeYemenZaireZimbabweAzores
Pakistani
Race
Ancestry
AfghanAfricanAlaska NativeAlaskan AthabascanAlbanianAleutAlsatianAmericanApacheArabArapahoArgentineanArmenianAssyrian/Chaldean/SyriacAustralianAustrianBahamianBangladeshiBarbadianBasqueBelgianBelizeanBermudanBhutaneseBlackfeetBolivianBrazilianBritishBritish West IndianBulgarianBurmeseCajunCambodianCanadianCape VerdeanCarpatho RusynCelticCentral AmericanCentral American IndianCherokeeCheyenneChickasawChileanChineseChippewaChoctawColombianColvilleComancheCosta RicanCreeCreekCroatianCrowCubanCypriotCzechCzechoslovakianDanishDelawareDominicanDutchDutch West IndianEastern EuropeanEcuadorianEgyptianEnglishEstonianEthiopianEuropeanFijianFilipinoFinnishFrenchFrench American IndianFrench CanadianGermanGerman RussianGhanaianGreekGuamanian/ChamorroGuatemalanGuyaneseHaitianHmongHonduranHopiHoumaHungarianIcelanderIndian (Asian)IndonesianInupiatIranianIraqiIrishIroquoisIsraeliItalianJamaicanJapaneseJordanianKenyanKiowaKoreanLaotianLatvianLebaneseLiberianLithuanianLumbeeLuxembourgerMacedonianMalaysianMalteseMarshalleseMenomineeMexicanMexican American IndianMongolianMoroccanNative HawaiianNavajoNepaleseNew ZealanderNicaraguanNigerianNorthern EuropeanNorwegianOkinawanOsageOttawaPaiutePakistaniPalestinianPanamanianParaguayanPennsylvania GermanPeruvianPimaPolishPortuguesePotawatomiPuebloPuerto RicanPuget Sound SalishRomanianRussianSalvadoranSamoanScandinavianScotch-IrishScottishSeminoleSenegaleseSerbianShoshoneSierra LeoneanSiouxSlavicSlovakSloveneSomaliSouth AfricanSouth AmericanSouth American IndianSoviet UnionSpaniardSpanishSpanish AmericanSpanish American IndianSri LankanSubsaharan AfricanSudaneseSwedishSwissSyrianTaiwaneseThaiTlingit-HaidaTohono O'OdhamTonganTrinidadian and TobagonianTsimshianTurkishU.S. Virgin IslanderUgandanUkrainianUruguayanUteVietnameseWelshWest IndianYakamaYaquiYugoslavianYumanYup'ikZimbabwean
Immigration
NonimmigrantsImmigrantsAfghanistanAfricaAlbaniaArgentinaArmeniaAsiaAustraliaAustriaBahamasBangladeshBarbadosBelarusBelgiumBelizeBoliviaBosnia and HerzegovinaBrazilBulgariaBurma/MyanmarCabo VerdeCambodiaCameroonCanadaCaribbeanCentral AmericaChileChinaColombiaCongoCosta RicaCroatiaCubaCzechoslovakiaDenmarkDominicaDominican RepublicEastern AfricaEastern AsiaEastern EuropeEcuadorEgyptEl SalvadorEnglandEritreaEthiopiaEuropeFijiFranceGermanyGhanaGreeceGrenadaGuatemalaGuyanaHaitiHondurasHong KongHungaryIndiaIndonesiaIranIraqIrelandIsraelItalyJamaicaJapanJordanKazakhstanKenyaKoreaKuwaitLaosLatin AmericaLatviaLebanonLiberiaLithuaniaMalaysiaMexicoMicronesiaMiddle AfricaMoldovaMoroccoNepalNetherlandsNicaraguaNigeriaNorth AmericaNorth MacedoniaNorthern AfricaNorthern EuropeNorwayOceaniaPakistanPanamaPeruPhilippinesPolandPortugalRomaniaRussiaSaudi ArabiaScotlandSenegalSerbiaSierra LeoneSingaporeSomaliaSouth AfricaSouth AmericaSouth Central AsiaSouth Eastern AsiaSouthern EuropeSpainSri LankaSt. Vincent and the GrenadinesSudanSwedenSwitzerlandSyriaTaiwanThailandTrinidad and TobagoTurkeyUgandaUkraineUruguayUzbekistanVenezuelaVietnamWest IndiesWestern AfricaWestern AsiaWestern EuropeYemenZaireZimbabweAzores
Seniors Poverty Over the Age of 65
Income
Poverty
Unemployment
Labor Participation
Family Structure
Vehicle Availability
Education Level
Disability

Seniors Poverty Over the Age of 65 Comparison

Venezuelans

Pakistanis

Tragic
Exceptional
12.5%
SENIORS POVERTY OVER THE AGE OF 65
0.1/ 100
METRIC RATING
262nd/ 347
METRIC RANK
10.3%
SENIORS POVERTY OVER THE AGE OF 65
92.2/ 100
METRIC RATING
116th/ 347
METRIC RANK

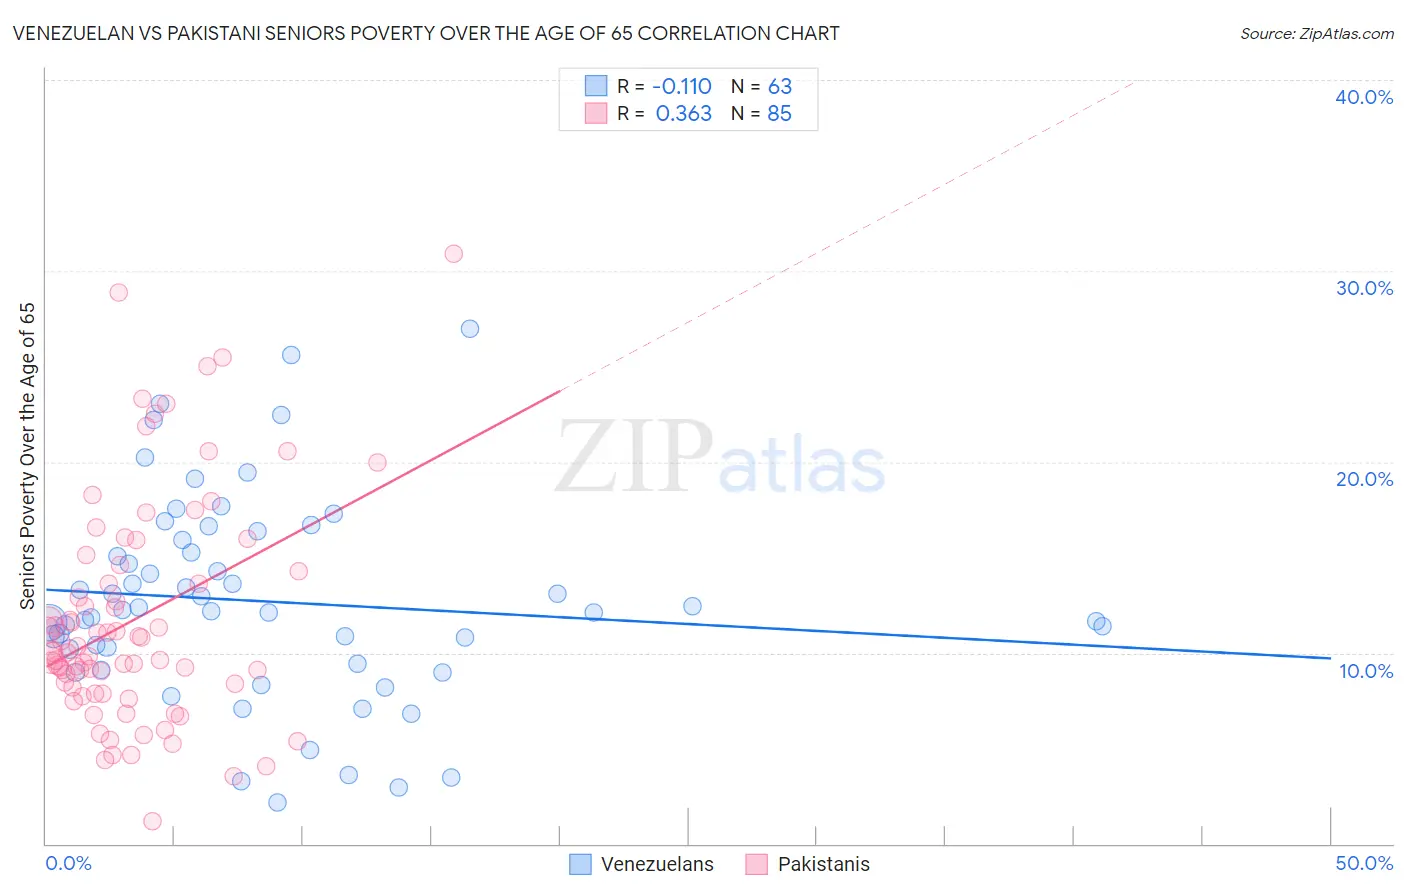
Venezuelan vs Pakistani Seniors Poverty Over the Age of 65 Correlation Chart

The statistical analysis conducted on geographies consisting of 305,272,622 people shows a poor negative correlation between the proportion of Venezuelans and poverty level among seniors over the age of 65 in the United States with a correlation coefficient (R) of -0.110 and weighted average of 12.5%. Similarly, the statistical analysis conducted on geographies consisting of 334,315,212 people shows a mild positive correlation between the proportion of Pakistanis and poverty level among seniors over the age of 65 in the United States with a correlation coefficient (R) of 0.363 and weighted average of 10.3%, a difference of 21.2%.
Venezuelan vs Pakistani Seniors Poverty Over the Age of 65

Seniors Poverty Over the Age of 65 Correlation Summary

MeasurementVenezuelanPakistani
Minimum2.2%1.2%
Maximum27.0%30.9%
Range24.8%29.7%
Mean12.7%11.8%
Median12.2%10.0%
Interquartile 25% (IQ1)9.4%8.0%
Interquartile 75% (IQ3)15.9%14.4%
Interquartile Range (IQR)6.5%6.4%
Standard Deviation (Sample)5.3%5.9%
Standard Deviation (Population)5.3%5.9%

Similar Demographics by Seniors Poverty Over the Age of 65

Demographics Similar to Venezuelans by Seniors Poverty Over the Age of 65

In terms of seniors poverty over the age of 65, the demographic groups most similar to Venezuelans are Soviet Union (12.6%, a difference of 0.17%), Colombian (12.5%, a difference of 0.20%), Inupiat (12.6%, a difference of 0.23%), Immigrants from Western Africa (12.6%, a difference of 0.32%), and South American (12.5%, a difference of 0.44%).
DemographicsRating | RankSeniors Poverty Over the Age of 65
Mexican American Indians
0.3
/100
|
#255
Tragic
12.4%
Immigrants | Panama
0.2
/100
|
#256
Tragic
12.4%
Immigrants | Immigrants
0.2
/100
|
#257
Tragic
12.4%
Dutch West Indians
0.2
/100
|
#258
Tragic
12.4%
Ghanaians
0.2
/100
|
#259
Tragic
12.4%
South Americans
0.2
/100
|
#260
Tragic
12.5%
Colombians
0.2
/100
|
#261
Tragic
12.5%
Venezuelans
0.1
/100
|
#262
Tragic
12.5%
Soviet Union
0.1
/100
|
#263
Tragic
12.6%
Inupiat
0.1
/100
|
#264
Tragic
12.6%
Immigrants | Western Africa
0.1
/100
|
#265
Tragic
12.6%
Africans
0.1
/100
|
#266
Tragic
12.6%
Blackfeet
0.1
/100
|
#267
Tragic
12.6%
Immigrants | Somalia
0.1
/100
|
#268
Tragic
12.6%
Immigrants | Venezuela
0.1
/100
|
#269
Tragic
12.7%

Demographics Similar to Pakistanis by Seniors Poverty Over the Age of 65

In terms of seniors poverty over the age of 65, the demographic groups most similar to Pakistanis are Lebanese (10.3%, a difference of 0.060%), Okinawan (10.4%, a difference of 0.14%), Immigrants from Italy (10.3%, a difference of 0.15%), Immigrants from Denmark (10.3%, a difference of 0.19%), and Immigrants from Western Europe (10.4%, a difference of 0.33%).
DemographicsRating | RankSeniors Poverty Over the Age of 65
Syrians
93.8
/100
|
#109
Exceptional
10.3%
Immigrants | Zimbabwe
93.5
/100
|
#110
Exceptional
10.3%
Immigrants | Belgium
93.4
/100
|
#111
Exceptional
10.3%
Immigrants | Korea
93.3
/100
|
#112
Exceptional
10.3%
Immigrants | Romania
93.3
/100
|
#113
Exceptional
10.3%
Immigrants | Denmark
92.7
/100
|
#114
Exceptional
10.3%
Immigrants | Italy
92.6
/100
|
#115
Exceptional
10.3%
Pakistanis
92.2
/100
|
#116
Exceptional
10.3%
Lebanese
92.0
/100
|
#117
Exceptional
10.3%
Okinawans
91.7
/100
|
#118
Exceptional
10.4%
Immigrants | Western Europe
91.1
/100
|
#119
Exceptional
10.4%
Immigrants | Bosnia and Herzegovina
90.8
/100
|
#120
Exceptional
10.4%
Immigrants | Iraq
90.7
/100
|
#121
Exceptional
10.4%
Immigrants | Moldova
90.7
/100
|
#122
Exceptional
10.4%
Hmong
90.0
/100
|
#123
Exceptional
10.4%