Venezuelan vs Irish Female Poverty
COMPARE
Venezuelan
Irish
Female Poverty
Female Poverty Comparison
Venezuelans
Irish
13.5%
FEMALE POVERTY
44.5/ 100
METRIC RATING
181st/ 347
METRIC RANK
12.4%
FEMALE POVERTY
96.5/ 100
METRIC RATING
85th/ 347
METRIC RANK
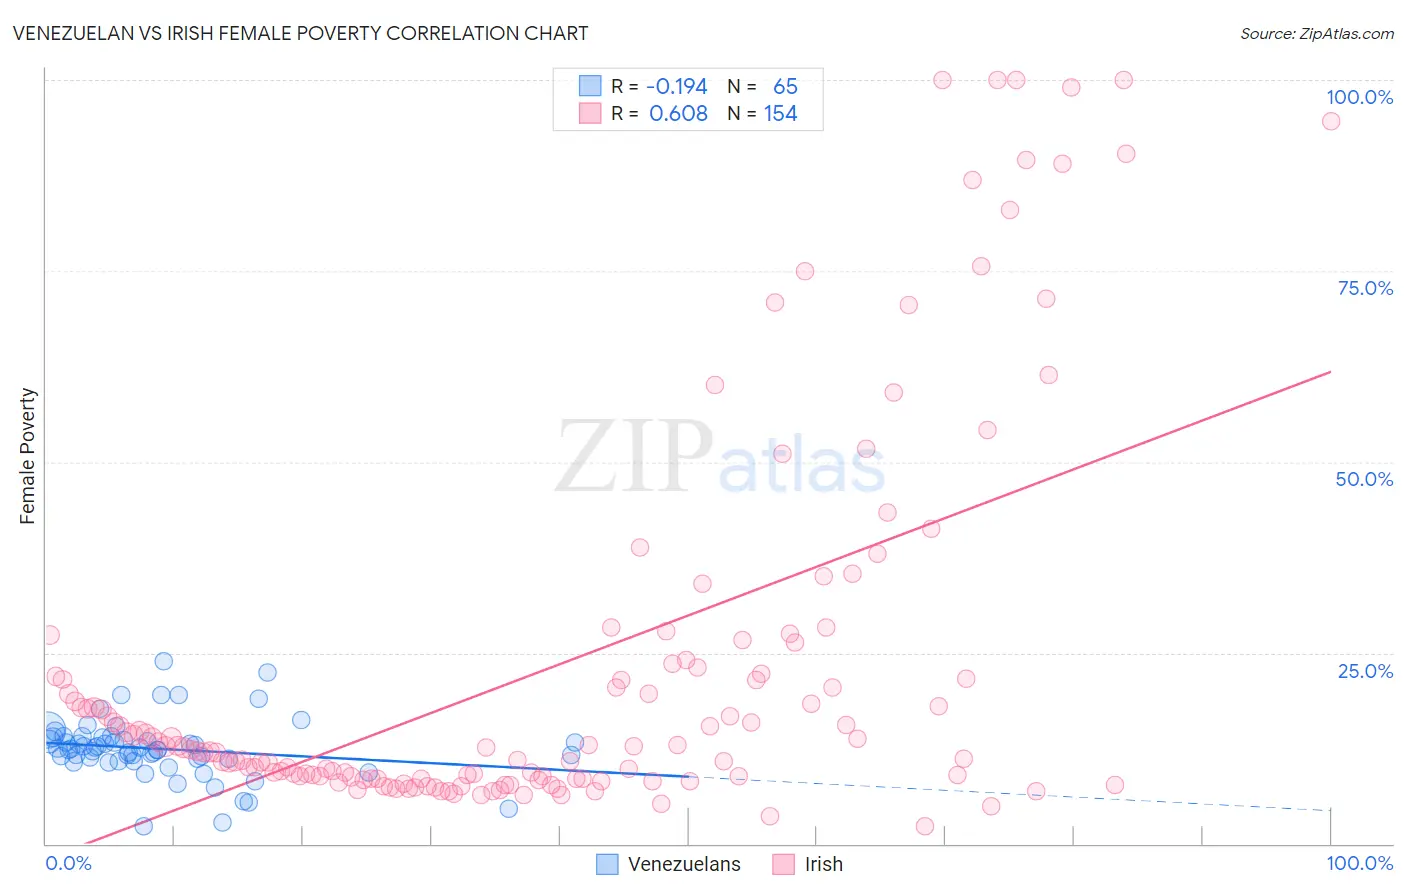
Venezuelan vs Irish Female Poverty Correlation Chart
The statistical analysis conducted on geographies consisting of 306,079,170 people shows a poor negative correlation between the proportion of Venezuelans and poverty level among females in the United States with a correlation coefficient (R) of -0.194 and weighted average of 13.5%. Similarly, the statistical analysis conducted on geographies consisting of 578,836,064 people shows a significant positive correlation between the proportion of Irish and poverty level among females in the United States with a correlation coefficient (R) of 0.608 and weighted average of 12.4%, a difference of 9.2%.
Female Poverty Correlation Summary
| Measurement | Venezuelan | Irish |
| Minimum | 2.3% | 2.3% |
| Maximum | 24.0% | 100.0% |
| Range | 21.7% | 97.7% |
| Mean | 12.4% | 23.1% |
| Median | 12.4% | 12.6% |
| Interquartile 25% (IQ1) | 11.0% | 8.5% |
| Interquartile 75% (IQ3) | 13.9% | 23.0% |
| Interquartile Range (IQR) | 2.9% | 14.6% |
| Standard Deviation (Sample) | 3.9% | 24.9% |
| Standard Deviation (Population) | 3.9% | 24.8% |
Similar Demographics by Female Poverty
Demographics Similar to Venezuelans by Female Poverty
In terms of female poverty, the demographic groups most similar to Venezuelans are Immigrants from Colombia (13.5%, a difference of 0.0%), South American (13.5%, a difference of 0.030%), Kenyan (13.5%, a difference of 0.070%), Immigrants from Sierra Leone (13.5%, a difference of 0.13%), and Immigrants from Cameroon (13.5%, a difference of 0.24%).
| Demographics | Rating | Rank | Female Poverty |
| Immigrants | Iraq | 50.0 /100 | #174 | Average 13.4% |
| Celtics | 49.9 /100 | #175 | Average 13.4% |
| Immigrants | Spain | 49.9 /100 | #176 | Average 13.4% |
| Immigrants | Morocco | 49.4 /100 | #177 | Average 13.4% |
| Israelis | 49.1 /100 | #178 | Average 13.5% |
| Immigrants | Syria | 48.8 /100 | #179 | Average 13.5% |
| South Americans | 44.8 /100 | #180 | Average 13.5% |
| Venezuelans | 44.5 /100 | #181 | Average 13.5% |
| Immigrants | Colombia | 44.5 /100 | #182 | Average 13.5% |
| Kenyans | 43.8 /100 | #183 | Average 13.5% |
| Immigrants | Sierra Leone | 43.2 /100 | #184 | Average 13.5% |
| Immigrants | Cameroon | 42.0 /100 | #185 | Average 13.5% |
| Immigrants | Portugal | 41.5 /100 | #186 | Average 13.6% |
| Immigrants | Venezuela | 41.0 /100 | #187 | Average 13.6% |
| Hawaiians | 39.9 /100 | #188 | Fair 13.6% |
Demographics Similar to Irish by Female Poverty
In terms of female poverty, the demographic groups most similar to Irish are Dutch (12.4%, a difference of 0.030%), Northern European (12.4%, a difference of 0.050%), Okinawan (12.4%, a difference of 0.050%), Finnish (12.4%, a difference of 0.090%), and Immigrants from England (12.3%, a difference of 0.29%).
| Demographics | Rating | Rank | Female Poverty |
| Egyptians | 97.2 /100 | #78 | Exceptional 12.3% |
| Immigrants | North America | 97.1 /100 | #79 | Exceptional 12.3% |
| Slovaks | 97.1 /100 | #80 | Exceptional 12.3% |
| Immigrants | Sweden | 97.1 /100 | #81 | Exceptional 12.3% |
| Jordanians | 97.1 /100 | #82 | Exceptional 12.3% |
| Immigrants | England | 96.9 /100 | #83 | Exceptional 12.3% |
| Northern Europeans | 96.6 /100 | #84 | Exceptional 12.4% |
| Irish | 96.5 /100 | #85 | Exceptional 12.4% |
| Dutch | 96.5 /100 | #86 | Exceptional 12.4% |
| Okinawans | 96.4 /100 | #87 | Exceptional 12.4% |
| Finns | 96.4 /100 | #88 | Exceptional 12.4% |
| English | 96.1 /100 | #89 | Exceptional 12.4% |
| Immigrants | Denmark | 95.8 /100 | #90 | Exceptional 12.4% |
| Belgians | 95.8 /100 | #91 | Exceptional 12.4% |
| Czechoslovakians | 95.7 /100 | #92 | Exceptional 12.4% |