Venezuelan vs Immigrants from Somalia Child Poverty Among Girls Under 16
COMPARE
Venezuelan
Immigrants from Somalia
Child Poverty Among Girls Under 16
Child Poverty Among Girls Under 16 Comparison
Venezuelans
Immigrants from Somalia
15.8%
CHILD POVERTY AMONG GIRLS UNDER 16
80.1/ 100
METRIC RATING
151st/ 347
METRIC RANK
21.6%
CHILD POVERTY AMONG GIRLS UNDER 16
0.0/ 100
METRIC RATING
310th/ 347
METRIC RANK
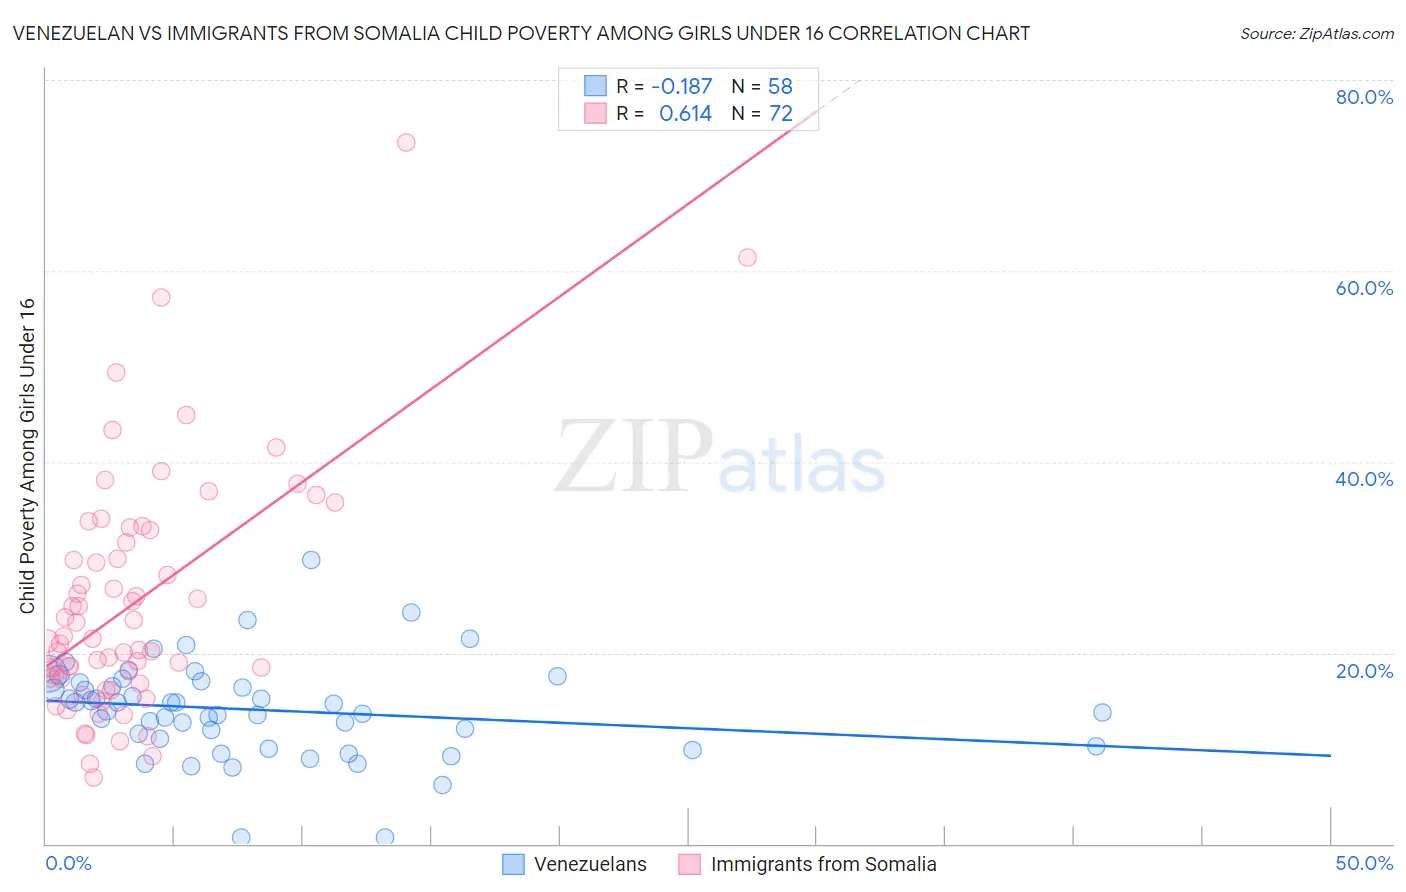
Venezuelan vs Immigrants from Somalia Child Poverty Among Girls Under 16 Correlation Chart
The statistical analysis conducted on geographies consisting of 302,424,022 people shows a poor negative correlation between the proportion of Venezuelans and poverty level among girls under the age of 16 in the United States with a correlation coefficient (R) of -0.187 and weighted average of 15.8%. Similarly, the statistical analysis conducted on geographies consisting of 91,884,287 people shows a significant positive correlation between the proportion of Immigrants from Somalia and poverty level among girls under the age of 16 in the United States with a correlation coefficient (R) of 0.614 and weighted average of 21.6%, a difference of 36.4%.
Child Poverty Among Girls Under 16 Correlation Summary
| Measurement | Venezuelan | Immigrants from Somalia |
| Minimum | 0.62% | 6.9% |
| Maximum | 29.7% | 73.5% |
| Range | 29.1% | 66.6% |
| Mean | 14.0% | 25.2% |
| Median | 14.3% | 21.3% |
| Interquartile 25% (IQ1) | 10.9% | 17.4% |
| Interquartile 75% (IQ3) | 16.9% | 32.2% |
| Interquartile Range (IQR) | 5.9% | 14.8% |
| Standard Deviation (Sample) | 5.1% | 12.5% |
| Standard Deviation (Population) | 5.0% | 12.4% |
Similar Demographics by Child Poverty Among Girls Under 16
Demographics Similar to Venezuelans by Child Poverty Among Girls Under 16
In terms of child poverty among girls under 16, the demographic groups most similar to Venezuelans are Immigrants from Albania (15.8%, a difference of 0.10%), Immigrants from Hungary (15.8%, a difference of 0.14%), Immigrants from Kuwait (15.8%, a difference of 0.14%), Immigrants from Nepal (15.9%, a difference of 0.29%), and Icelander (15.7%, a difference of 0.46%).
| Demographics | Rating | Rank | Child Poverty Among Girls Under 16 |
| Israelis | 86.3 /100 | #144 | Excellent 15.6% |
| Welsh | 85.4 /100 | #145 | Excellent 15.6% |
| Samoans | 84.2 /100 | #146 | Excellent 15.7% |
| Slavs | 83.1 /100 | #147 | Excellent 15.7% |
| Icelanders | 82.4 /100 | #148 | Excellent 15.7% |
| Immigrants | Hungary | 80.9 /100 | #149 | Excellent 15.8% |
| Immigrants | Albania | 80.7 /100 | #150 | Excellent 15.8% |
| Venezuelans | 80.1 /100 | #151 | Excellent 15.8% |
| Immigrants | Kuwait | 79.4 /100 | #152 | Good 15.8% |
| Immigrants | Nepal | 78.5 /100 | #153 | Good 15.9% |
| Immigrants | Chile | 76.7 /100 | #154 | Good 15.9% |
| Syrians | 76.7 /100 | #155 | Good 15.9% |
| Immigrants | Fiji | 76.1 /100 | #156 | Good 15.9% |
| Colombians | 76.1 /100 | #157 | Good 15.9% |
| Guamanians/Chamorros | 75.3 /100 | #158 | Good 15.9% |
Demographics Similar to Immigrants from Somalia by Child Poverty Among Girls Under 16
In terms of child poverty among girls under 16, the demographic groups most similar to Immigrants from Somalia are Dutch West Indian (21.6%, a difference of 0.060%), Bahamian (21.5%, a difference of 0.27%), Immigrants from Mexico (21.6%, a difference of 0.29%), Houma (21.5%, a difference of 0.39%), and Immigrants from Bahamas (21.4%, a difference of 0.57%).
| Demographics | Rating | Rank | Child Poverty Among Girls Under 16 |
| British West Indians | 0.0 /100 | #303 | Tragic 21.3% |
| Indonesians | 0.0 /100 | #304 | Tragic 21.3% |
| Guatemalans | 0.0 /100 | #305 | Tragic 21.4% |
| Immigrants | Central America | 0.0 /100 | #306 | Tragic 21.4% |
| Immigrants | Bahamas | 0.0 /100 | #307 | Tragic 21.4% |
| Houma | 0.0 /100 | #308 | Tragic 21.5% |
| Bahamians | 0.0 /100 | #309 | Tragic 21.5% |
| Immigrants | Somalia | 0.0 /100 | #310 | Tragic 21.6% |
| Dutch West Indians | 0.0 /100 | #311 | Tragic 21.6% |
| Immigrants | Mexico | 0.0 /100 | #312 | Tragic 21.6% |
| Creek | 0.0 /100 | #313 | Tragic 21.7% |
| Arapaho | 0.0 /100 | #314 | Tragic 21.7% |
| Ute | 0.0 /100 | #315 | Tragic 21.8% |
| Immigrants | Guatemala | 0.0 /100 | #316 | Tragic 21.9% |
| Africans | 0.0 /100 | #317 | Tragic 21.9% |