Venezuelan vs Immigrants from Eastern Africa Single Father Poverty
COMPARE
Venezuelan
Immigrants from Eastern Africa
Single Father Poverty
Single Father Poverty Comparison
Venezuelans
Immigrants from Eastern Africa
16.6%
SINGLE FATHER POVERTY
14.3/ 100
METRIC RATING
205th/ 347
METRIC RANK
14.7%
SINGLE FATHER POVERTY
100.0/ 100
METRIC RATING
37th/ 347
METRIC RANK
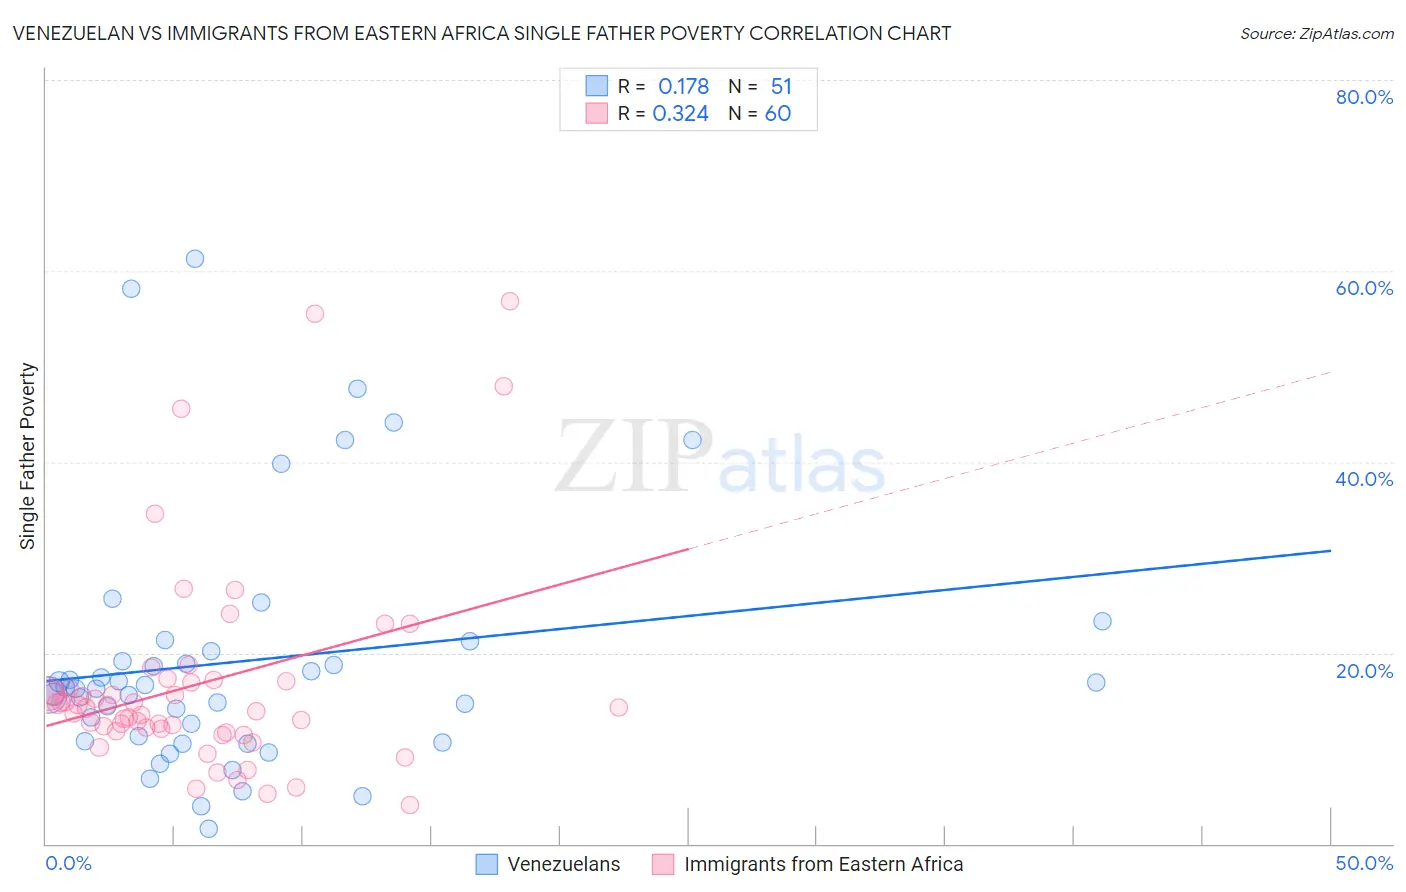
Venezuelan vs Immigrants from Eastern Africa Single Father Poverty Correlation Chart
The statistical analysis conducted on geographies consisting of 250,129,202 people shows a poor positive correlation between the proportion of Venezuelans and poverty level among single fathers in the United States with a correlation coefficient (R) of 0.178 and weighted average of 16.6%. Similarly, the statistical analysis conducted on geographies consisting of 287,393,274 people shows a mild positive correlation between the proportion of Immigrants from Eastern Africa and poverty level among single fathers in the United States with a correlation coefficient (R) of 0.324 and weighted average of 14.7%, a difference of 13.0%.
Single Father Poverty Correlation Summary
| Measurement | Venezuelan | Immigrants from Eastern Africa |
| Minimum | 1.6% | 4.1% |
| Maximum | 61.3% | 56.8% |
| Range | 59.7% | 52.7% |
| Mean | 19.1% | 16.7% |
| Median | 16.3% | 14.3% |
| Interquartile 25% (IQ1) | 10.7% | 11.9% |
| Interquartile 75% (IQ3) | 20.2% | 16.9% |
| Interquartile Range (IQR) | 9.5% | 5.0% |
| Standard Deviation (Sample) | 13.0% | 10.8% |
| Standard Deviation (Population) | 12.9% | 10.8% |
Similar Demographics by Single Father Poverty
Demographics Similar to Venezuelans by Single Father Poverty
In terms of single father poverty, the demographic groups most similar to Venezuelans are Immigrants from Guatemala (16.6%, a difference of 0.040%), Immigrants from Senegal (16.6%, a difference of 0.050%), New Zealander (16.6%, a difference of 0.050%), Eastern European (16.6%, a difference of 0.050%), and Immigrants from North America (16.6%, a difference of 0.070%).
| Demographics | Rating | Rank | Single Father Poverty |
| Romanians | 20.1 /100 | #198 | Fair 16.5% |
| Immigrants | Belize | 19.8 /100 | #199 | Poor 16.5% |
| Syrians | 17.4 /100 | #200 | Poor 16.6% |
| Cubans | 16.5 /100 | #201 | Poor 16.6% |
| Immigrants | Croatia | 16.5 /100 | #202 | Poor 16.6% |
| Immigrants | North America | 15.1 /100 | #203 | Poor 16.6% |
| Immigrants | Guatemala | 14.8 /100 | #204 | Poor 16.6% |
| Venezuelans | 14.3 /100 | #205 | Poor 16.6% |
| Immigrants | Senegal | 13.7 /100 | #206 | Poor 16.6% |
| New Zealanders | 13.7 /100 | #207 | Poor 16.6% |
| Eastern Europeans | 13.7 /100 | #208 | Poor 16.6% |
| Europeans | 13.2 /100 | #209 | Poor 16.6% |
| Guatemalans | 12.9 /100 | #210 | Poor 16.6% |
| Arabs | 12.8 /100 | #211 | Poor 16.6% |
| Immigrants | Southern Europe | 11.2 /100 | #212 | Poor 16.7% |
Demographics Similar to Immigrants from Eastern Africa by Single Father Poverty
In terms of single father poverty, the demographic groups most similar to Immigrants from Eastern Africa are Bolivian (14.7%, a difference of 0.010%), Immigrants from Indonesia (14.7%, a difference of 0.13%), Immigrants from Asia (14.7%, a difference of 0.19%), Immigrants from Bolivia (14.7%, a difference of 0.29%), and Egyptian (14.7%, a difference of 0.36%).
| Demographics | Rating | Rank | Single Father Poverty |
| Thais | 100.0 /100 | #30 | Exceptional 14.5% |
| Icelanders | 100.0 /100 | #31 | Exceptional 14.5% |
| Asians | 100.0 /100 | #32 | Exceptional 14.6% |
| Okinawans | 100.0 /100 | #33 | Exceptional 14.6% |
| Egyptians | 100.0 /100 | #34 | Exceptional 14.7% |
| Immigrants | Bolivia | 100.0 /100 | #35 | Exceptional 14.7% |
| Immigrants | Indonesia | 100.0 /100 | #36 | Exceptional 14.7% |
| Immigrants | Eastern Africa | 100.0 /100 | #37 | Exceptional 14.7% |
| Bolivians | 100.0 /100 | #38 | Exceptional 14.7% |
| Immigrants | Asia | 100.0 /100 | #39 | Exceptional 14.7% |
| Pima | 100.0 /100 | #40 | Exceptional 14.8% |
| Indians (Asian) | 100.0 /100 | #41 | Exceptional 14.8% |
| Immigrants | Nepal | 100.0 /100 | #42 | Exceptional 14.8% |
| Immigrants | Eritrea | 100.0 /100 | #43 | Exceptional 14.8% |
| Salvadorans | 100.0 /100 | #44 | Exceptional 14.9% |