Ute vs South American Child Poverty Under the Age of 5
COMPARE
Ute
South American
Child Poverty Under the Age of 5
Child Poverty Under the Age of 5 Comparison
Ute
South Americans
23.5%
CHILD POVERTY UNDER THE AGE OF 5
0.0/ 100
METRIC RATING
322nd/ 347
METRIC RANK
16.7%
CHILD POVERTY UNDER THE AGE OF 5
75.1/ 100
METRIC RATING
155th/ 347
METRIC RANK
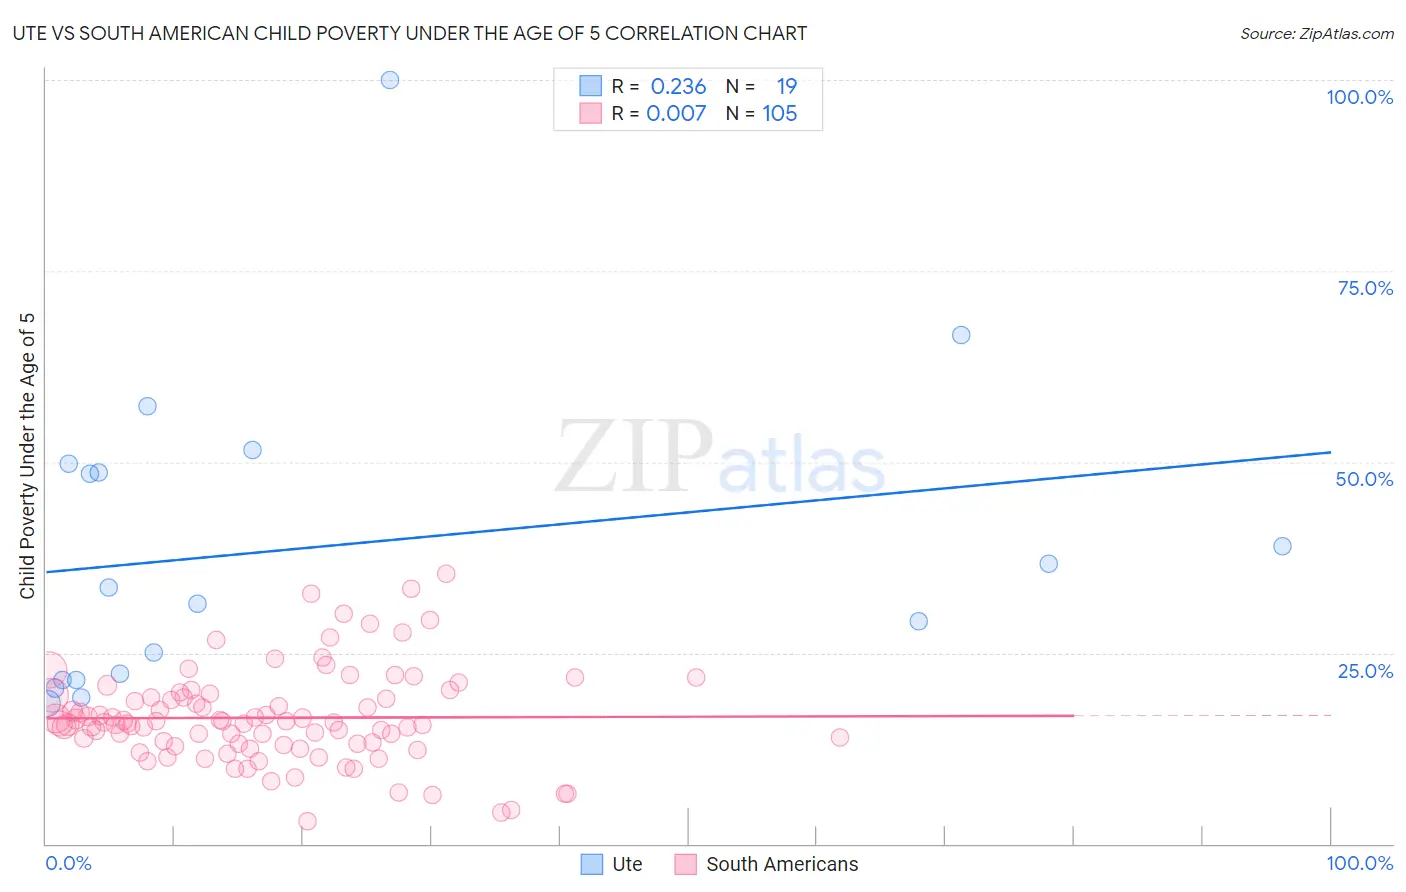
Ute vs South American Child Poverty Under the Age of 5 Correlation Chart
The statistical analysis conducted on geographies consisting of 55,277,980 people shows a weak positive correlation between the proportion of Ute and poverty level among children under the age of 5 in the United States with a correlation coefficient (R) of 0.236 and weighted average of 23.5%. Similarly, the statistical analysis conducted on geographies consisting of 468,225,362 people shows no correlation between the proportion of South Americans and poverty level among children under the age of 5 in the United States with a correlation coefficient (R) of 0.007 and weighted average of 16.7%, a difference of 40.7%.
Child Poverty Under the Age of 5 Correlation Summary
| Measurement | Ute | South American |
| Minimum | 18.4% | 2.9% |
| Maximum | 100.0% | 35.3% |
| Range | 81.6% | 32.4% |
| Mean | 38.9% | 16.5% |
| Median | 33.5% | 15.8% |
| Interquartile 25% (IQ1) | 21.4% | 13.0% |
| Interquartile 75% (IQ3) | 49.7% | 19.3% |
| Interquartile Range (IQR) | 28.3% | 6.3% |
| Standard Deviation (Sample) | 20.7% | 6.1% |
| Standard Deviation (Population) | 20.2% | 6.1% |
Similar Demographics by Child Poverty Under the Age of 5
Demographics Similar to Ute by Child Poverty Under the Age of 5
In terms of child poverty under the age of 5, the demographic groups most similar to Ute are Immigrants from Honduras (23.5%, a difference of 0.23%), Choctaw (23.5%, a difference of 0.26%), Pueblo (23.7%, a difference of 0.58%), Chippewa (23.4%, a difference of 0.64%), and Dutch West Indian (23.3%, a difference of 1.1%).
| Demographics | Rating | Rank | Child Poverty Under the Age of 5 |
| Arapaho | 0.0 /100 | #315 | Tragic 23.1% |
| Yakama | 0.0 /100 | #316 | Tragic 23.1% |
| Menominee | 0.0 /100 | #317 | Tragic 23.3% |
| Dutch West Indians | 0.0 /100 | #318 | Tragic 23.3% |
| Chippewa | 0.0 /100 | #319 | Tragic 23.4% |
| Choctaw | 0.0 /100 | #320 | Tragic 23.5% |
| Immigrants | Honduras | 0.0 /100 | #321 | Tragic 23.5% |
| Ute | 0.0 /100 | #322 | Tragic 23.5% |
| Pueblo | 0.0 /100 | #323 | Tragic 23.7% |
| Paiute | 0.0 /100 | #324 | Tragic 23.8% |
| Immigrants | Congo | 0.0 /100 | #325 | Tragic 23.9% |
| Central American Indians | 0.0 /100 | #326 | Tragic 23.9% |
| Dominicans | 0.0 /100 | #327 | Tragic 24.0% |
| Immigrants | Dominican Republic | 0.0 /100 | #328 | Tragic 24.1% |
| Cajuns | 0.0 /100 | #329 | Tragic 24.1% |
Demographics Similar to South Americans by Child Poverty Under the Age of 5
In terms of child poverty under the age of 5, the demographic groups most similar to South Americans are Afghan (16.8%, a difference of 0.10%), Immigrants from Venezuela (16.7%, a difference of 0.13%), Venezuelan (16.8%, a difference of 0.19%), Dutch (16.7%, a difference of 0.29%), and Belgian (16.7%, a difference of 0.31%).
| Demographics | Rating | Rank | Child Poverty Under the Age of 5 |
| Syrians | 79.1 /100 | #148 | Good 16.6% |
| New Zealanders | 78.7 /100 | #149 | Good 16.6% |
| Colombians | 77.8 /100 | #150 | Good 16.7% |
| Canadians | 77.6 /100 | #151 | Good 16.7% |
| Belgians | 77.2 /100 | #152 | Good 16.7% |
| Dutch | 77.1 /100 | #153 | Good 16.7% |
| Immigrants | Venezuela | 76.0 /100 | #154 | Good 16.7% |
| South Americans | 75.1 /100 | #155 | Good 16.7% |
| Afghans | 74.4 /100 | #156 | Good 16.8% |
| Venezuelans | 73.7 /100 | #157 | Good 16.8% |
| Czechoslovakians | 72.5 /100 | #158 | Good 16.8% |
| Immigrants | Syria | 72.3 /100 | #159 | Good 16.8% |
| Irish | 72.0 /100 | #160 | Good 16.8% |
| English | 70.4 /100 | #161 | Good 16.8% |
| Costa Ricans | 69.8 /100 | #162 | Good 16.9% |