Ute vs Immigrants from Lithuania Female Poverty
COMPARE
Ute
Immigrants from Lithuania
Female Poverty
Female Poverty Comparison
Ute
Immigrants from Lithuania
17.5%
FEMALE POVERTY
0.0/ 100
METRIC RATING
318th/ 347
METRIC RANK
11.3%
FEMALE POVERTY
99.9/ 100
METRIC RATING
13th/ 347
METRIC RANK
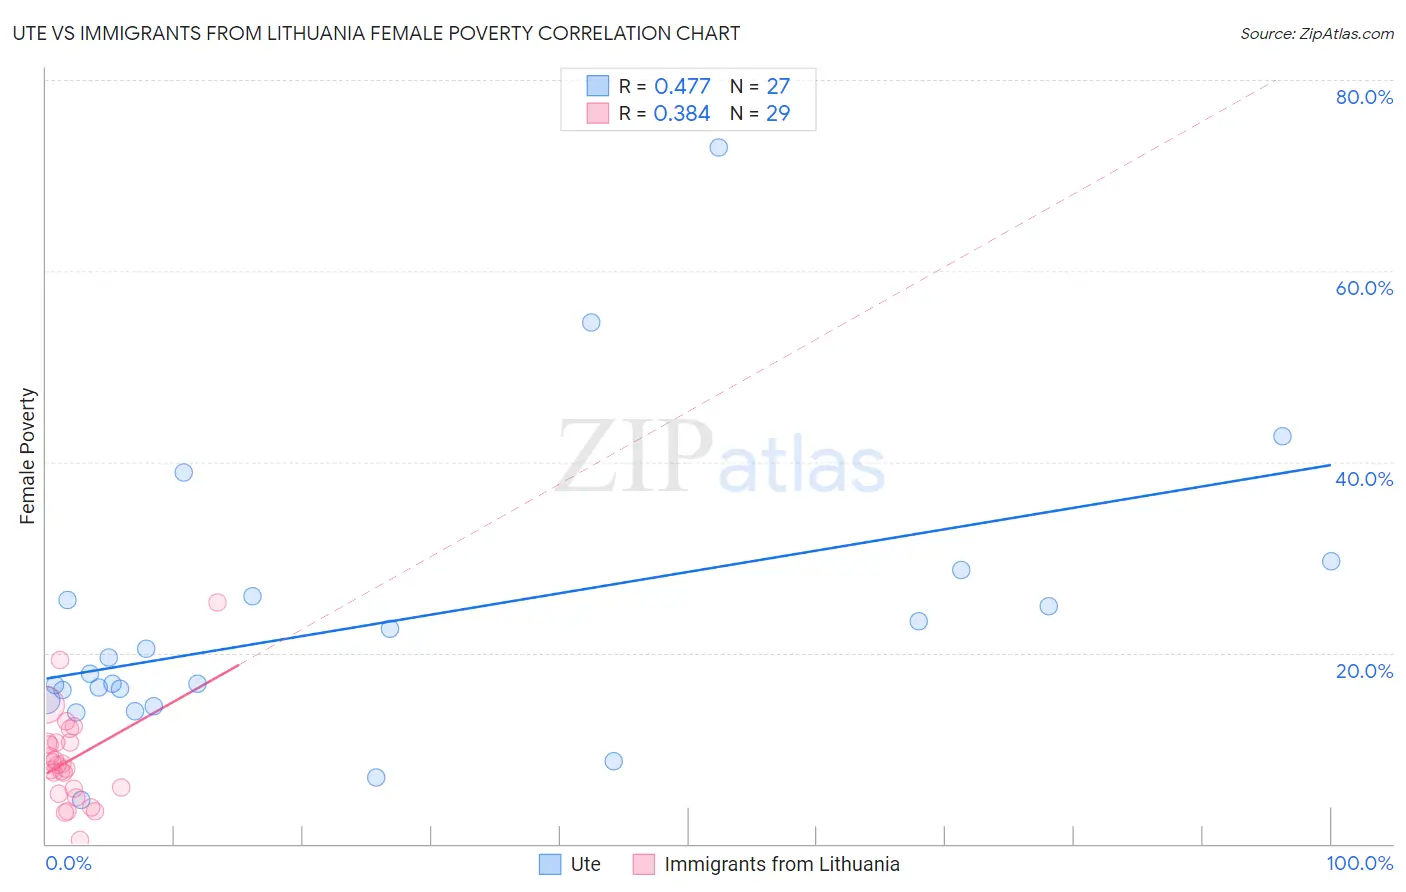
Ute vs Immigrants from Lithuania Female Poverty Correlation Chart
The statistical analysis conducted on geographies consisting of 55,666,863 people shows a moderate positive correlation between the proportion of Ute and poverty level among females in the United States with a correlation coefficient (R) of 0.477 and weighted average of 17.5%. Similarly, the statistical analysis conducted on geographies consisting of 117,711,686 people shows a mild positive correlation between the proportion of Immigrants from Lithuania and poverty level among females in the United States with a correlation coefficient (R) of 0.384 and weighted average of 11.3%, a difference of 54.6%.
Female Poverty Correlation Summary
| Measurement | Ute | Immigrants from Lithuania |
| Minimum | 4.6% | 0.39% |
| Maximum | 73.0% | 25.2% |
| Range | 68.4% | 24.8% |
| Mean | 23.1% | 8.8% |
| Median | 17.9% | 8.3% |
| Interquartile 25% (IQ1) | 15.1% | 5.5% |
| Interquartile 75% (IQ3) | 25.9% | 10.6% |
| Interquartile Range (IQR) | 10.9% | 5.1% |
| Standard Deviation (Sample) | 14.7% | 5.0% |
| Standard Deviation (Population) | 14.5% | 4.9% |
Similar Demographics by Female Poverty
Demographics Similar to Ute by Female Poverty
In terms of female poverty, the demographic groups most similar to Ute are Cajun (17.5%, a difference of 0.010%), Immigrants from Dominica (17.5%, a difference of 0.10%), Arapaho (17.5%, a difference of 0.16%), Immigrants from Congo (17.4%, a difference of 0.32%), and Honduran (17.4%, a difference of 0.52%).
| Demographics | Rating | Rank | Female Poverty |
| Immigrants | Guatemala | 0.0 /100 | #311 | Tragic 17.0% |
| Immigrants | Somalia | 0.0 /100 | #312 | Tragic 17.0% |
| British West Indians | 0.0 /100 | #313 | Tragic 17.0% |
| Dutch West Indians | 0.0 /100 | #314 | Tragic 17.1% |
| U.S. Virgin Islanders | 0.0 /100 | #315 | Tragic 17.3% |
| Hondurans | 0.0 /100 | #316 | Tragic 17.4% |
| Immigrants | Congo | 0.0 /100 | #317 | Tragic 17.4% |
| Ute | 0.0 /100 | #318 | Tragic 17.5% |
| Cajuns | 0.0 /100 | #319 | Tragic 17.5% |
| Immigrants | Dominica | 0.0 /100 | #320 | Tragic 17.5% |
| Arapaho | 0.0 /100 | #321 | Tragic 17.5% |
| Menominee | 0.0 /100 | #322 | Tragic 17.6% |
| Paiute | 0.0 /100 | #323 | Tragic 17.7% |
| Immigrants | Honduras | 0.0 /100 | #324 | Tragic 17.7% |
| Colville | 0.0 /100 | #325 | Tragic 17.8% |
Demographics Similar to Immigrants from Lithuania by Female Poverty
In terms of female poverty, the demographic groups most similar to Immigrants from Lithuania are Bhutanese (11.3%, a difference of 0.010%), Maltese (11.2%, a difference of 0.47%), Immigrants from Hong Kong (11.2%, a difference of 0.58%), Lithuanian (11.4%, a difference of 0.96%), and Latvian (11.4%, a difference of 1.3%).
| Demographics | Rating | Rank | Female Poverty |
| Immigrants | Ireland | 99.9 /100 | #6 | Exceptional 11.0% |
| Assyrians/Chaldeans/Syriacs | 99.9 /100 | #7 | Exceptional 11.0% |
| Immigrants | South Central Asia | 99.9 /100 | #8 | Exceptional 11.1% |
| Bulgarians | 99.9 /100 | #9 | Exceptional 11.1% |
| Immigrants | Hong Kong | 99.9 /100 | #10 | Exceptional 11.2% |
| Maltese | 99.9 /100 | #11 | Exceptional 11.2% |
| Bhutanese | 99.9 /100 | #12 | Exceptional 11.3% |
| Immigrants | Lithuania | 99.9 /100 | #13 | Exceptional 11.3% |
| Lithuanians | 99.8 /100 | #14 | Exceptional 11.4% |
| Latvians | 99.8 /100 | #15 | Exceptional 11.4% |
| Immigrants | Bolivia | 99.8 /100 | #16 | Exceptional 11.5% |
| Bolivians | 99.8 /100 | #17 | Exceptional 11.5% |
| Immigrants | Scotland | 99.8 /100 | #18 | Exceptional 11.5% |
| Norwegians | 99.8 /100 | #19 | Exceptional 11.5% |
| Eastern Europeans | 99.7 /100 | #20 | Exceptional 11.5% |