Ute vs Immigrants from Cabo Verde Child Poverty Among Boys Under 16
COMPARE
Ute
Immigrants from Cabo Verde
Child Poverty Among Boys Under 16
Child Poverty Among Boys Under 16 Comparison
Ute
Immigrants from Cabo Verde
21.6%
CHILD POVERTY AMONG BOYS UNDER 16
0.0/ 100
METRIC RATING
314th/ 347
METRIC RANK
19.7%
CHILD POVERTY AMONG BOYS UNDER 16
0.1/ 100
METRIC RATING
269th/ 347
METRIC RANK
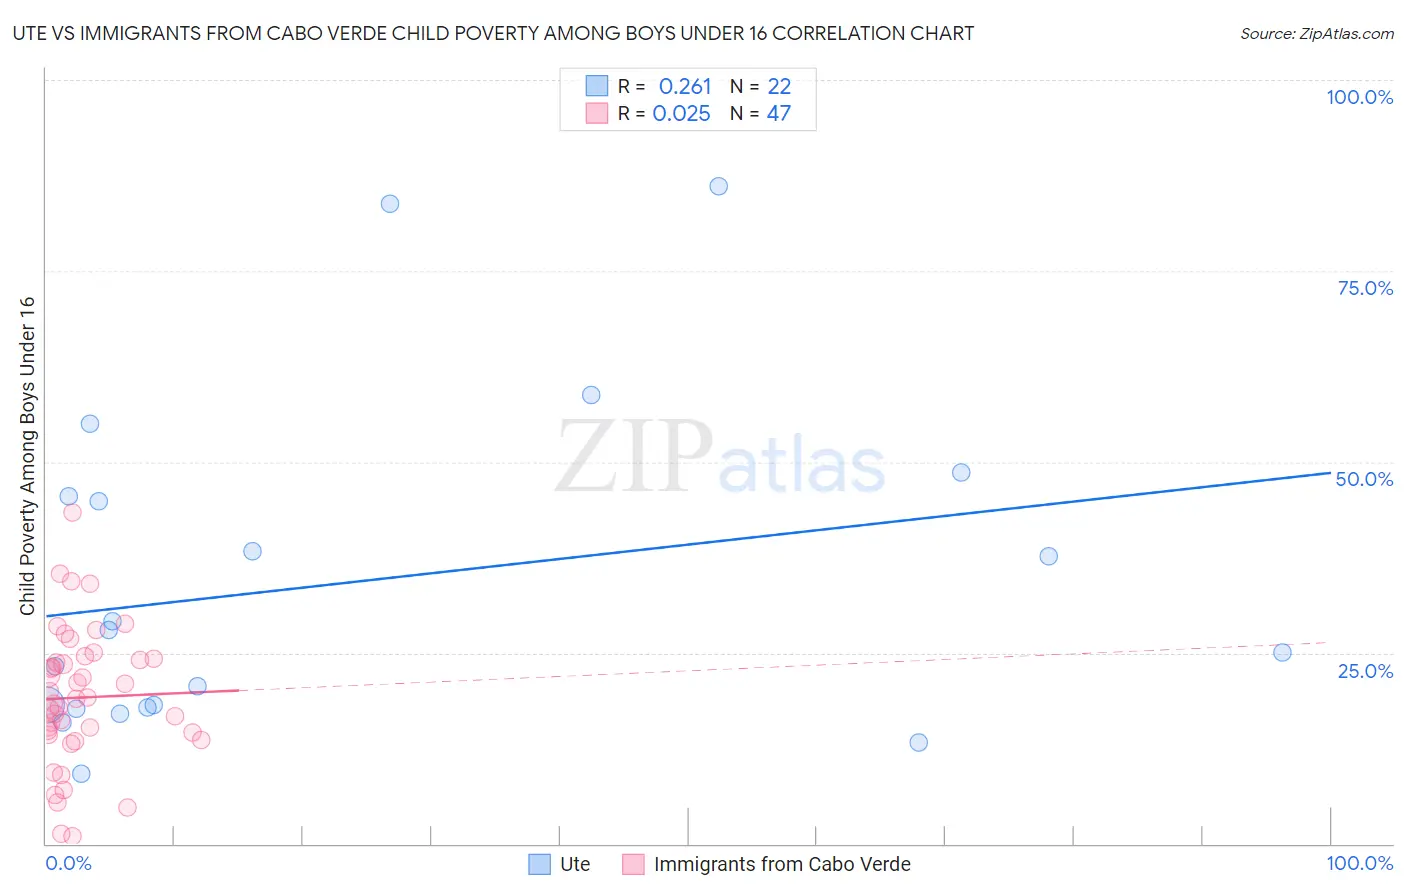
Ute vs Immigrants from Cabo Verde Child Poverty Among Boys Under 16 Correlation Chart
The statistical analysis conducted on geographies consisting of 55,537,245 people shows a weak positive correlation between the proportion of Ute and poverty level among boys under the age of 16 in the United States with a correlation coefficient (R) of 0.261 and weighted average of 21.6%. Similarly, the statistical analysis conducted on geographies consisting of 37,877,952 people shows no correlation between the proportion of Immigrants from Cabo Verde and poverty level among boys under the age of 16 in the United States with a correlation coefficient (R) of 0.025 and weighted average of 19.7%, a difference of 9.8%.
Child Poverty Among Boys Under 16 Correlation Summary
| Measurement | Ute | Immigrants from Cabo Verde |
| Minimum | 9.2% | 1.0% |
| Maximum | 86.0% | 43.4% |
| Range | 76.9% | 42.4% |
| Mean | 34.2% | 19.1% |
| Median | 26.5% | 18.9% |
| Interquartile 25% (IQ1) | 17.8% | 14.2% |
| Interquartile 75% (IQ3) | 45.5% | 24.2% |
| Interquartile Range (IQR) | 27.7% | 10.0% |
| Standard Deviation (Sample) | 21.7% | 8.9% |
| Standard Deviation (Population) | 21.2% | 8.8% |
Similar Demographics by Child Poverty Among Boys Under 16
Demographics Similar to Ute by Child Poverty Among Boys Under 16
In terms of child poverty among boys under 16, the demographic groups most similar to Ute are British West Indian (21.6%, a difference of 0.010%), Immigrants from Guatemala (21.6%, a difference of 0.020%), Bahamian (21.6%, a difference of 0.10%), Creek (21.5%, a difference of 0.21%), and Seminole (21.5%, a difference of 0.27%).
| Demographics | Rating | Rank | Child Poverty Among Boys Under 16 |
| Choctaw | 0.0 /100 | #307 | Tragic 21.3% |
| Immigrants | Mexico | 0.0 /100 | #308 | Tragic 21.5% |
| Seminole | 0.0 /100 | #309 | Tragic 21.5% |
| Creek | 0.0 /100 | #310 | Tragic 21.5% |
| Bahamians | 0.0 /100 | #311 | Tragic 21.6% |
| Immigrants | Guatemala | 0.0 /100 | #312 | Tragic 21.6% |
| British West Indians | 0.0 /100 | #313 | Tragic 21.6% |
| Ute | 0.0 /100 | #314 | Tragic 21.6% |
| Immigrants | Somalia | 0.0 /100 | #315 | Tragic 21.7% |
| Menominee | 0.0 /100 | #316 | Tragic 21.7% |
| Africans | 0.0 /100 | #317 | Tragic 21.7% |
| Yakama | 0.0 /100 | #318 | Tragic 21.7% |
| Dutch West Indians | 0.0 /100 | #319 | Tragic 21.8% |
| U.S. Virgin Islanders | 0.0 /100 | #320 | Tragic 22.0% |
| Cajuns | 0.0 /100 | #321 | Tragic 22.2% |
Demographics Similar to Immigrants from Cabo Verde by Child Poverty Among Boys Under 16
In terms of child poverty among boys under 16, the demographic groups most similar to Immigrants from Cabo Verde are Spanish American Indian (19.6%, a difference of 0.16%), Vietnamese (19.6%, a difference of 0.27%), Cherokee (19.7%, a difference of 0.28%), Immigrants from El Salvador (19.6%, a difference of 0.29%), and Guyanese (19.6%, a difference of 0.33%).
| Demographics | Rating | Rank | Child Poverty Among Boys Under 16 |
| Immigrants | Guyana | 0.1 /100 | #262 | Tragic 19.5% |
| Ottawa | 0.1 /100 | #263 | Tragic 19.5% |
| Iroquois | 0.1 /100 | #264 | Tragic 19.6% |
| Guyanese | 0.1 /100 | #265 | Tragic 19.6% |
| Immigrants | El Salvador | 0.1 /100 | #266 | Tragic 19.6% |
| Vietnamese | 0.1 /100 | #267 | Tragic 19.6% |
| Spanish American Indians | 0.1 /100 | #268 | Tragic 19.6% |
| Immigrants | Cabo Verde | 0.1 /100 | #269 | Tragic 19.7% |
| Cherokee | 0.1 /100 | #270 | Tragic 19.7% |
| Chickasaw | 0.1 /100 | #271 | Tragic 19.8% |
| Immigrants | Ecuador | 0.1 /100 | #272 | Tragic 19.8% |
| Belizeans | 0.1 /100 | #273 | Tragic 19.9% |
| Immigrants | Bangladesh | 0.0 /100 | #274 | Tragic 19.9% |
| Jamaicans | 0.0 /100 | #275 | Tragic 20.0% |
| Sub-Saharan Africans | 0.0 /100 | #276 | Tragic 20.0% |