U.S. Virgin Islander vs Immigrants from Japan Single Mother Poverty
COMPARE
U.S. Virgin Islander
Immigrants from Japan
Single Mother Poverty
Single Mother Poverty Comparison
U.S. Virgin Islanders
Immigrants from Japan
32.6%
SINGLE MOTHER POVERTY
0.0/ 100
METRIC RATING
289th/ 347
METRIC RANK
26.4%
SINGLE MOTHER POVERTY
100.0/ 100
METRIC RATING
27th/ 347
METRIC RANK
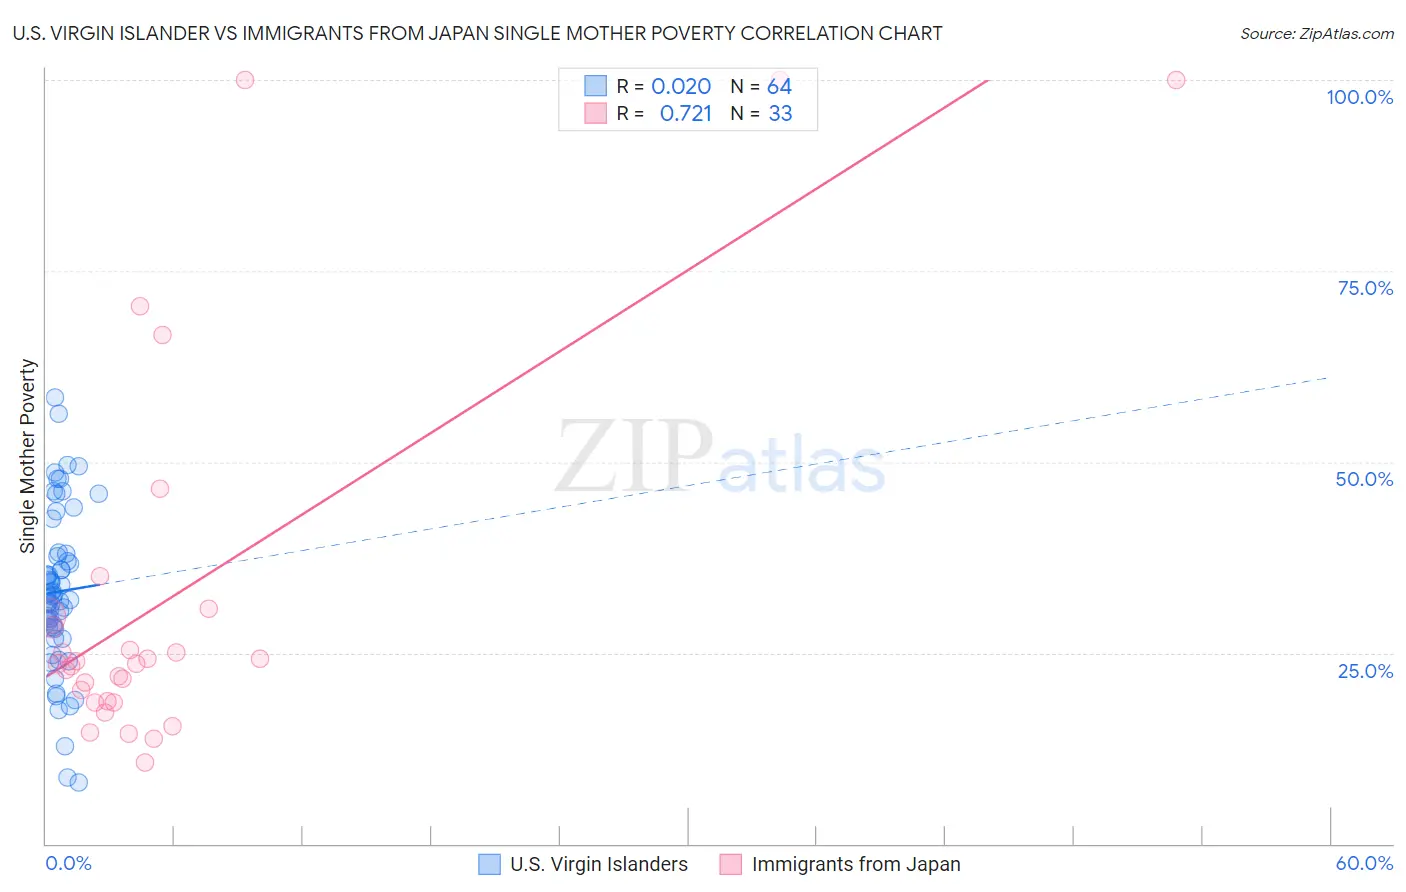
U.S. Virgin Islander vs Immigrants from Japan Single Mother Poverty Correlation Chart
The statistical analysis conducted on geographies consisting of 87,215,550 people shows no correlation between the proportion of U.S. Virgin Islanders and poverty level among single mothers in the United States with a correlation coefficient (R) of 0.020 and weighted average of 32.6%. Similarly, the statistical analysis conducted on geographies consisting of 332,940,354 people shows a strong positive correlation between the proportion of Immigrants from Japan and poverty level among single mothers in the United States with a correlation coefficient (R) of 0.721 and weighted average of 26.4%, a difference of 23.4%.
Single Mother Poverty Correlation Summary
| Measurement | U.S. Virgin Islander | Immigrants from Japan |
| Minimum | 8.0% | 10.7% |
| Maximum | 58.4% | 100.0% |
| Range | 50.4% | 89.3% |
| Mean | 33.0% | 32.6% |
| Median | 32.4% | 23.6% |
| Interquartile 25% (IQ1) | 28.2% | 18.6% |
| Interquartile 75% (IQ3) | 37.8% | 30.2% |
| Interquartile Range (IQR) | 9.6% | 11.6% |
| Standard Deviation (Sample) | 10.5% | 25.2% |
| Standard Deviation (Population) | 10.4% | 24.8% |
Similar Demographics by Single Mother Poverty
Demographics Similar to U.S. Virgin Islanders by Single Mother Poverty
In terms of single mother poverty, the demographic groups most similar to U.S. Virgin Islanders are Somali (32.6%, a difference of 0.030%), Osage (32.6%, a difference of 0.11%), Immigrants from Dominica (32.5%, a difference of 0.25%), Yup'ik (32.5%, a difference of 0.38%), and Immigrants from Latin America (32.4%, a difference of 0.45%).
| Demographics | Rating | Rank | Single Mother Poverty |
| Immigrants | Azores | 0.0 /100 | #282 | Tragic 32.2% |
| Spanish Americans | 0.0 /100 | #283 | Tragic 32.3% |
| Indonesians | 0.0 /100 | #284 | Tragic 32.4% |
| Immigrants | Latin America | 0.0 /100 | #285 | Tragic 32.4% |
| Yup'ik | 0.0 /100 | #286 | Tragic 32.5% |
| Immigrants | Dominica | 0.0 /100 | #287 | Tragic 32.5% |
| Somalis | 0.0 /100 | #288 | Tragic 32.6% |
| U.S. Virgin Islanders | 0.0 /100 | #289 | Tragic 32.6% |
| Osage | 0.0 /100 | #290 | Tragic 32.6% |
| Guatemalans | 0.0 /100 | #291 | Tragic 32.9% |
| Shoshone | 0.0 /100 | #292 | Tragic 32.9% |
| Aleuts | 0.0 /100 | #293 | Tragic 32.9% |
| French American Indians | 0.0 /100 | #294 | Tragic 33.1% |
| Yaqui | 0.0 /100 | #295 | Tragic 33.1% |
| Blackfeet | 0.0 /100 | #296 | Tragic 33.2% |
Demographics Similar to Immigrants from Japan by Single Mother Poverty
In terms of single mother poverty, the demographic groups most similar to Immigrants from Japan are Korean (26.4%, a difference of 0.010%), Jordanian (26.4%, a difference of 0.070%), Turkish (26.4%, a difference of 0.15%), Immigrants from Sri Lanka (26.3%, a difference of 0.22%), and Immigrants from Philippines (26.5%, a difference of 0.31%).
| Demographics | Rating | Rank | Single Mother Poverty |
| Immigrants | China | 100.0 /100 | #20 | Exceptional 26.1% |
| Immigrants | Bolivia | 100.0 /100 | #21 | Exceptional 26.2% |
| Immigrants | Korea | 100.0 /100 | #22 | Exceptional 26.2% |
| Burmese | 100.0 /100 | #23 | Exceptional 26.2% |
| Immigrants | Moldova | 100.0 /100 | #24 | Exceptional 26.2% |
| Immigrants | Asia | 100.0 /100 | #25 | Exceptional 26.3% |
| Immigrants | Sri Lanka | 100.0 /100 | #26 | Exceptional 26.3% |
| Immigrants | Japan | 100.0 /100 | #27 | Exceptional 26.4% |
| Koreans | 100.0 /100 | #28 | Exceptional 26.4% |
| Jordanians | 100.0 /100 | #29 | Exceptional 26.4% |
| Turks | 100.0 /100 | #30 | Exceptional 26.4% |
| Immigrants | Philippines | 100.0 /100 | #31 | Exceptional 26.5% |
| Tongans | 99.9 /100 | #32 | Exceptional 26.5% |
| Bulgarians | 99.9 /100 | #33 | Exceptional 26.5% |
| Immigrants | Indonesia | 99.9 /100 | #34 | Exceptional 26.6% |